 拾光
拾光 Gleanings · 001
The Smash Starts at Your Feet
From kinetic-chain biomechanics to long-term athlete development
Prelude: The Myth Everyone Believes
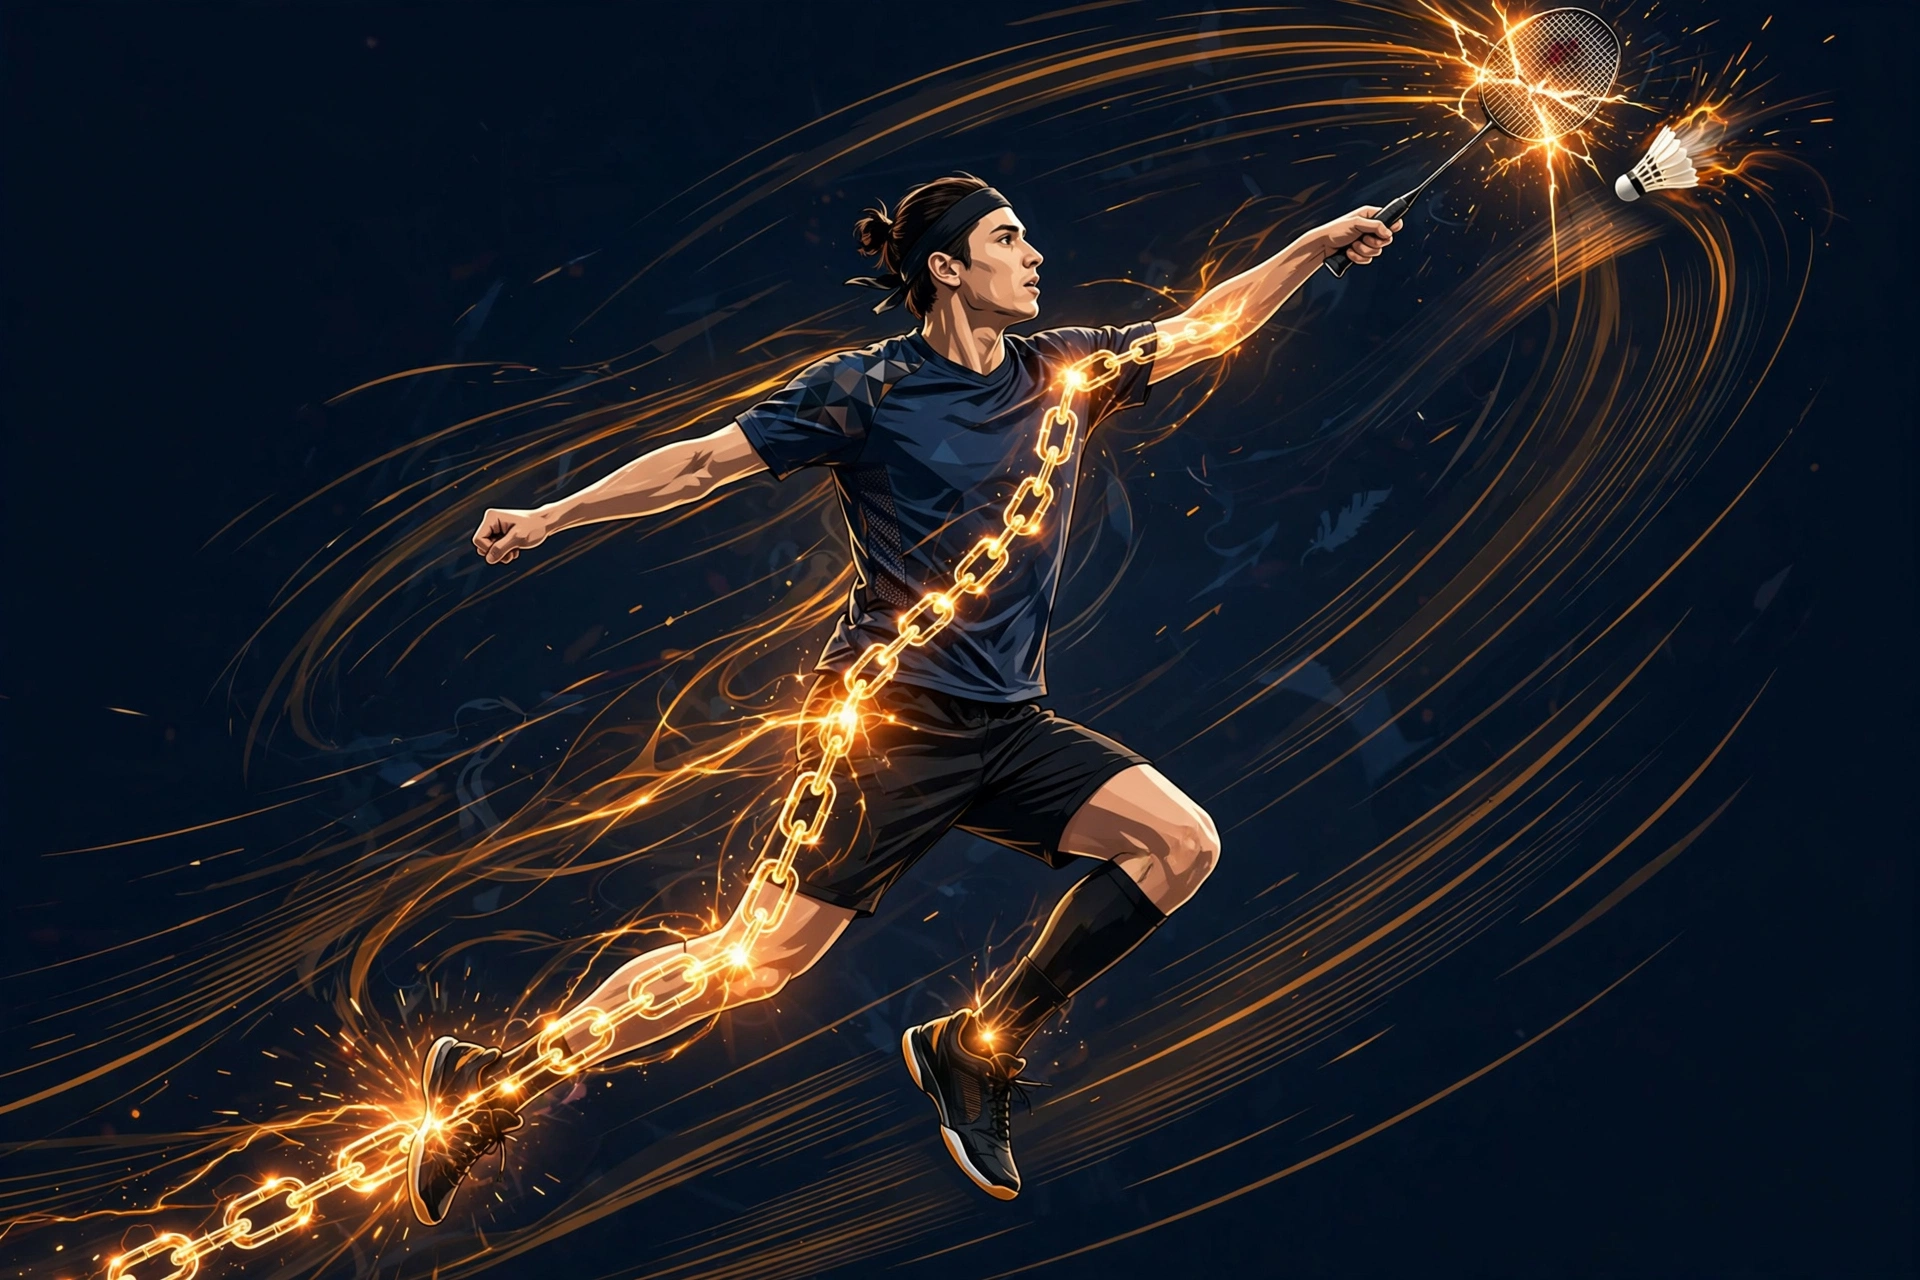
Most people think a hard smash is about the arm. So training becomes endless swings and wrist drills. Sports science says the opposite: the ceiling of shuttle speed is set not by the arm, but by the integrity of the entire kinetic chain.
The badminton smash is one of the most violent upper-limb actions the human body can produce — lab records show shuttle speeds above 288 km/h for the very best, around 252 km/h for elite players, and about 108 km/h for juniors (J. Funct. Morphol. Kinesiol., 2026). Output that extreme cannot come from one arm. The whole body has to crack like a whip, flinging energy from the floor up to the racket face, link by link. Any link that drops the baton, and the energy leaks halfway — or detonates, in compensation form, at the wrong joint. That detonation is what we call injury.
This essay covers four things: first, how the kinetic chain actually moves energy, and what the lab data say; second, why 41%–92% of badminton injuries land in the lower limbs, and why the root of shoulder pain may not be the shoulder; third, why at ages 11–13 you're not training muscle but "neural software"; and fourth, a chapter for parents of young players — every dollar you spend should be buying your child's athletic lifespan.
The Physics of the Whip: From Metaphor to Lab Data
"The kinetic chain is like a whip" — every coach says it. But in 2010, Rasmussen and colleagues put a number on the whip for the first time, using a musculoskeletal model: in a high-speed jump smash, peak power at the wrist briefly exceeds 1 kilowatt — a rate of power transfer beyond what muscle alone can produce, which means the energy travels by whipping through joint reaction forces, not by muscles pushing it along segment by segment. More important still, the joints hit peak power in strict proximal-to-distal order: shoulder first, then elbow, then wrist (Rasmussen et al., 2010).
Get the order right and speed follows. In 2020, King and colleagues at Loughborough ran 3D kinematics on 18 experienced players and found: peak linear velocity at the wrist correlated with shuttle speed at r = 0.767 — the strongest predictor of any variable measured; and the proximal side of the equation — pelvic–thoracic separation at the end of the backswing (the X-factor) plus the duration of the acceleration phase — explained 43.7% of the variance in shuttle speed. In plain language: the more the torso coils during the backswing and the more explosive the acceleration phase, the faster the shuttle. The wrist is only the final crack of the whip; the real work is done in the trunk (King et al., Appl. Sci., 2020).
This "proximal work, distal release" pattern was quantified even earlier: Teu and colleagues measured trunk rotation contributing roughly 57% of racket-head speed; while shoulder rotation plus forearm pronation together accounted for about 53% of terminal shuttle speed (the two figures come from different studies with different decomposition methods — they can't simply be added, but they point the same way). The activation order has been nailed down by EMG studies: hip and spinal joints rotate first → shoulder external rotation → elbow flexion with supination → shoulder internal rotation → elbow extension → forearm pronation. Note that forearm rotation (pronation on the forehand) is the main terminal accelerator; the folk wisdom of "flicking the wrist" barely exists in a high-speed smash (Phomsoupha & Laffaye, Sports Med., 2015).
in the jump smash
(Rasmussen et al., 2010)
linear velocity and shuttle speed
(King et al., 2020)
by X-factor and acceleration-phase duration
(King et al., 2020)
So how much of this chain belongs to the legs? Good question — and it deserves an honest answer: no study has yet produced a clean "the legs contribute X%" figure. What we have is correlational: peak ground reaction force correlates with shuttle speed at r = 0.548, jump height with racket-head speed at r = 0.494 (King et al., 2020). The mechanistic reading: the legs don't push the shuttle directly; they amplify terminal speed indirectly, through greater trunk rotation and proximal momentum. Jumping higher doesn't mean smashing harder — the real tactical value of the jump is a steeper smash angle.
Five Links in the Chain — Not One Is Optional
Back to the training framework. The badminton kinetic chain breaks into five links: ankle–knee–hip–core–shoulder. The ankle delivers the final push and absorbs landings; the knee is the main battlefield of deceleration and change of direction; the hip is the body's biggest engine; the core is the transmission shaft that must not leak; the shoulder is the exit where energy is finally handed to the racket.
The cruelty of this chain: it never rewards the strongest link — it only punishes the weakest one. All the hip explosiveness in the world means nothing if the core isn't stiff enough; energy leaks out through the trunk. And a rock-solid core means nothing if the ankle can't absorb: every lunge landing becomes one more micro-impact entered in the ledger. A 2026 study of U11 players produced a telling piece of corroboration: among 24 ten-year-old competitive players, after adjusting for sex and upper-limb length, only isometric shoulder strength independently predicted shuttle speed, explaining 57.2–63.8% of the variance. In other words, at the junior stage, the strength of the proximal link — the shoulder — directly sets the chain's output ceiling. The same study recorded the linear climb of shuttle speed with level: ~108 km/h for juniors → ~252 km/h for elite → over 288 km/h for the very best (J. Funct. Morphol. Kinesiol., 2026).
The real job of core training is not "getting abs." It is "losing nothing" — delivering every joule the legs produce, undiminished, to the upper body.
The War Underfoot: Every Footstrike Is an Impact
Badminton may be the busiest-footed of all ball sports: braking, lunging, sidestepping, split-stepping, crossover steps — a high-level men's singles match demands hundreds of direction changes. And every footstrike is an impact.
A 2025 study in BMC measured ground reaction forces in forehand and backhand lunges in recreational players: touchdown shows the classic double-peaked curve — an initial impact of about 1.2× body weight, followed by a second peak of 1.5–1.7× body weight. An interesting sex difference emerged: women absorbed a significantly higher second peak on the forehand lunge than the backhand (0.19× body weight higher), while men's loading rate ran about 9.6 N/kg% higher than women's — in other words, women take the bigger peak, men take the steeper hit. Which suggests injury-prevention programs should differ by sex (BMC Sports Sci. Med. Rehabil., 2025).
The longer the stride, the harder the hit. At 1.5× leg length, the first peak reaches 1.97±0.28× body weight, maxing at 2.18±0.25× body weight (Nielsen et al., via BMC 2025); review papers routinely cite 2.1–2.5× body weight of vertical impact hammering the feet during jumps, lunges, and direction changes. Wide lunges make up more than 15% of all court movement (Kuntze et al., 2010), and a 2026 machine-learning study of ACL loading flagged the two biggest drivers of ACL load spikes: small knee-flexion angle at landing and a low hamstring-to-quadriceps strength ratio (Front. Bioeng. Biotechnol., 2026).

in long lunges and jumps
(× body weight)
taken by wide lunges
(Kuntze et al., 2010)
from neuromuscular training
(Sports Med., 2025)
More alarming is the neuromuscular signature of badminton footwork: a 2026 wearable-EMG study found players brake in a quadriceps-dominant, "knee-dominant" pattern — net kill, defensive lunge, recovery step: every action first drops the center of mass fast and lets the knee "eat" the horizontal momentum, then reverses instantly (Appl. Sci., 2026). The stronger the quads, the harder the braking — and the harder the pull on the patellar tendon and the ACL. Which is why, in badminton, the knee always deserves your worry before the shoulder does.
Injury Epidemiology: The Numbers Don't Lie
A 2025 systematic review in BMJ Open, pooling 19 studies, mapped the full landscape of badminton injury: incidence of 1–4 per 1,000 hours per year; lower-limb injuries 41%–92%; overuse injuries 25%–74%. The old regulars are ankle sprains and patellar tendinopathy: a survey of 254 veteran Asian players found ankle sprains at 23.5% and patellar tendinopathy at 20.3%, with change of direction the most common mechanism for knee and ankle injuries (Pengked et al., 2025; BMJ Open Sport Exerc. Med., 2025).
The junior picture looks different. A 2026 scoping review found lower-limb injuries at 58.3% in youth players, knee and ankle most common; older juniors skew toward overuse injuries, younger ones toward acute injuries — tracking exactly the transition from "learning technique" to "competing" (Front. Sports Active Living, 2026). A study of 366 players aged 7–12 drew an even steeper curve: pain incidence per 1,000 hours climbs from 1.22 at ages 7–8, to 2.29 at 9–10, to 4.34 at 11–12; and in every age group, kids in their 2nd–3rd year of playing hurt the most — the authors' reading: this is the "danger window" where players cross from technique learning into competition, training intensity spikes while technique is still immature (Children, 2023).
The single most severe injury is the ACL tear. A Danish registry study of 539 players drew the classic mechanism: after an overhead shot from the backhand corner, a single-leg landing on the non-dominant leg — reaching across to hit a forehand from the backhand side forces the trunk to lean over the landing leg, the knee valgus moment explodes, and the ACL tears in that one instant. Stiff landings (knee and hip too straight), hip adduction and internal rotation, are the risk postures (PMC registry study; Kimura et al. video analysis).
Most injuries aren't "bad luck." They are the physical consequence of a body that can't carry its technical load — load exceeding what the tissue can currently bear.
The Root of Shoulder Pain May Not Be the Shoulder
A lot of recreational players' shoulder pain is actually written in the legs and core. A study of national-championship-level players described the overhead action as an energy chain: a "break" anywhere in the chain feeds shoulder pain and injury (Zhou et al., BWF, 2024). The logic: if the hip can't rotate enough and the core can't transmit, the shoulder has to work overtime to get the shuttle over — bigger ranges, uglier angles, all compensation. In the short term it's a workaround; over the long term it's chronic wear on the rotator cuff.
This direction now has prospective evidence: an elite-player study confirmed, for the first time in badminton, that a low preseason shoulder functional deceleration ratio and a glenohumeral internal rotation deficit (GIRD) beyond 14° are independent risk factors for in-season shoulder injury (Phys. Ther. Sport, 2023). A Japanese study found that swinging with the shoulder near 90° of abduction produces faster racket speed and bigger energy from the trunk's large muscles — but elbow and shoulder joint loading climbs with it; and the shoulder's internal–external rotation pattern correlates with elbow pain — players with immature technique who "compensate with the shoulder" may be generating elbow pain through exactly this kinetic-chain mechanism (J-STAGE, 2023).
U11–U13: You're Not Training Muscle, You're Writing Neural Software
This is the most counterintuitive — and most important — chapter in the whole LTAD framework: strength gains at ages 11–13 come not from growing muscle, but from upgrading the nervous system.
The NSCA's position statement on youth resistance training is explicit: prepubertal strength gains come primarily from neural adaptation, not hypertrophy — with circulating testosterone and other anabolic hormones too low, children can train for 20 weeks and barely add muscle mass. The real adaptation happens in the nervous system: more motor units recruited, higher firing rates, better intermuscular coordination, less antagonist co-contraction — plus the learning of the movement skill itself. In computer terms: this stage upgrades the software and the drivers, not the RAM (Faigenbaum et al., NSCA).
And this "software-writing" window is exactly when plasticity peaks. Balyi's LTAD model proposes the first speed window at ages 7–9, the second at 11–13 for girls and 13–15 for boys; the best strength window comes after peak height velocity (PHV). Fair disclosure: Ford and colleagues' 2010 review found the empirical base for the "windows" concept thinner than advertised — but one point commands consensus: prepubertal training gains come mainly from the neural and coordinative side (Ford et al., J. Sports Sci., 2010).
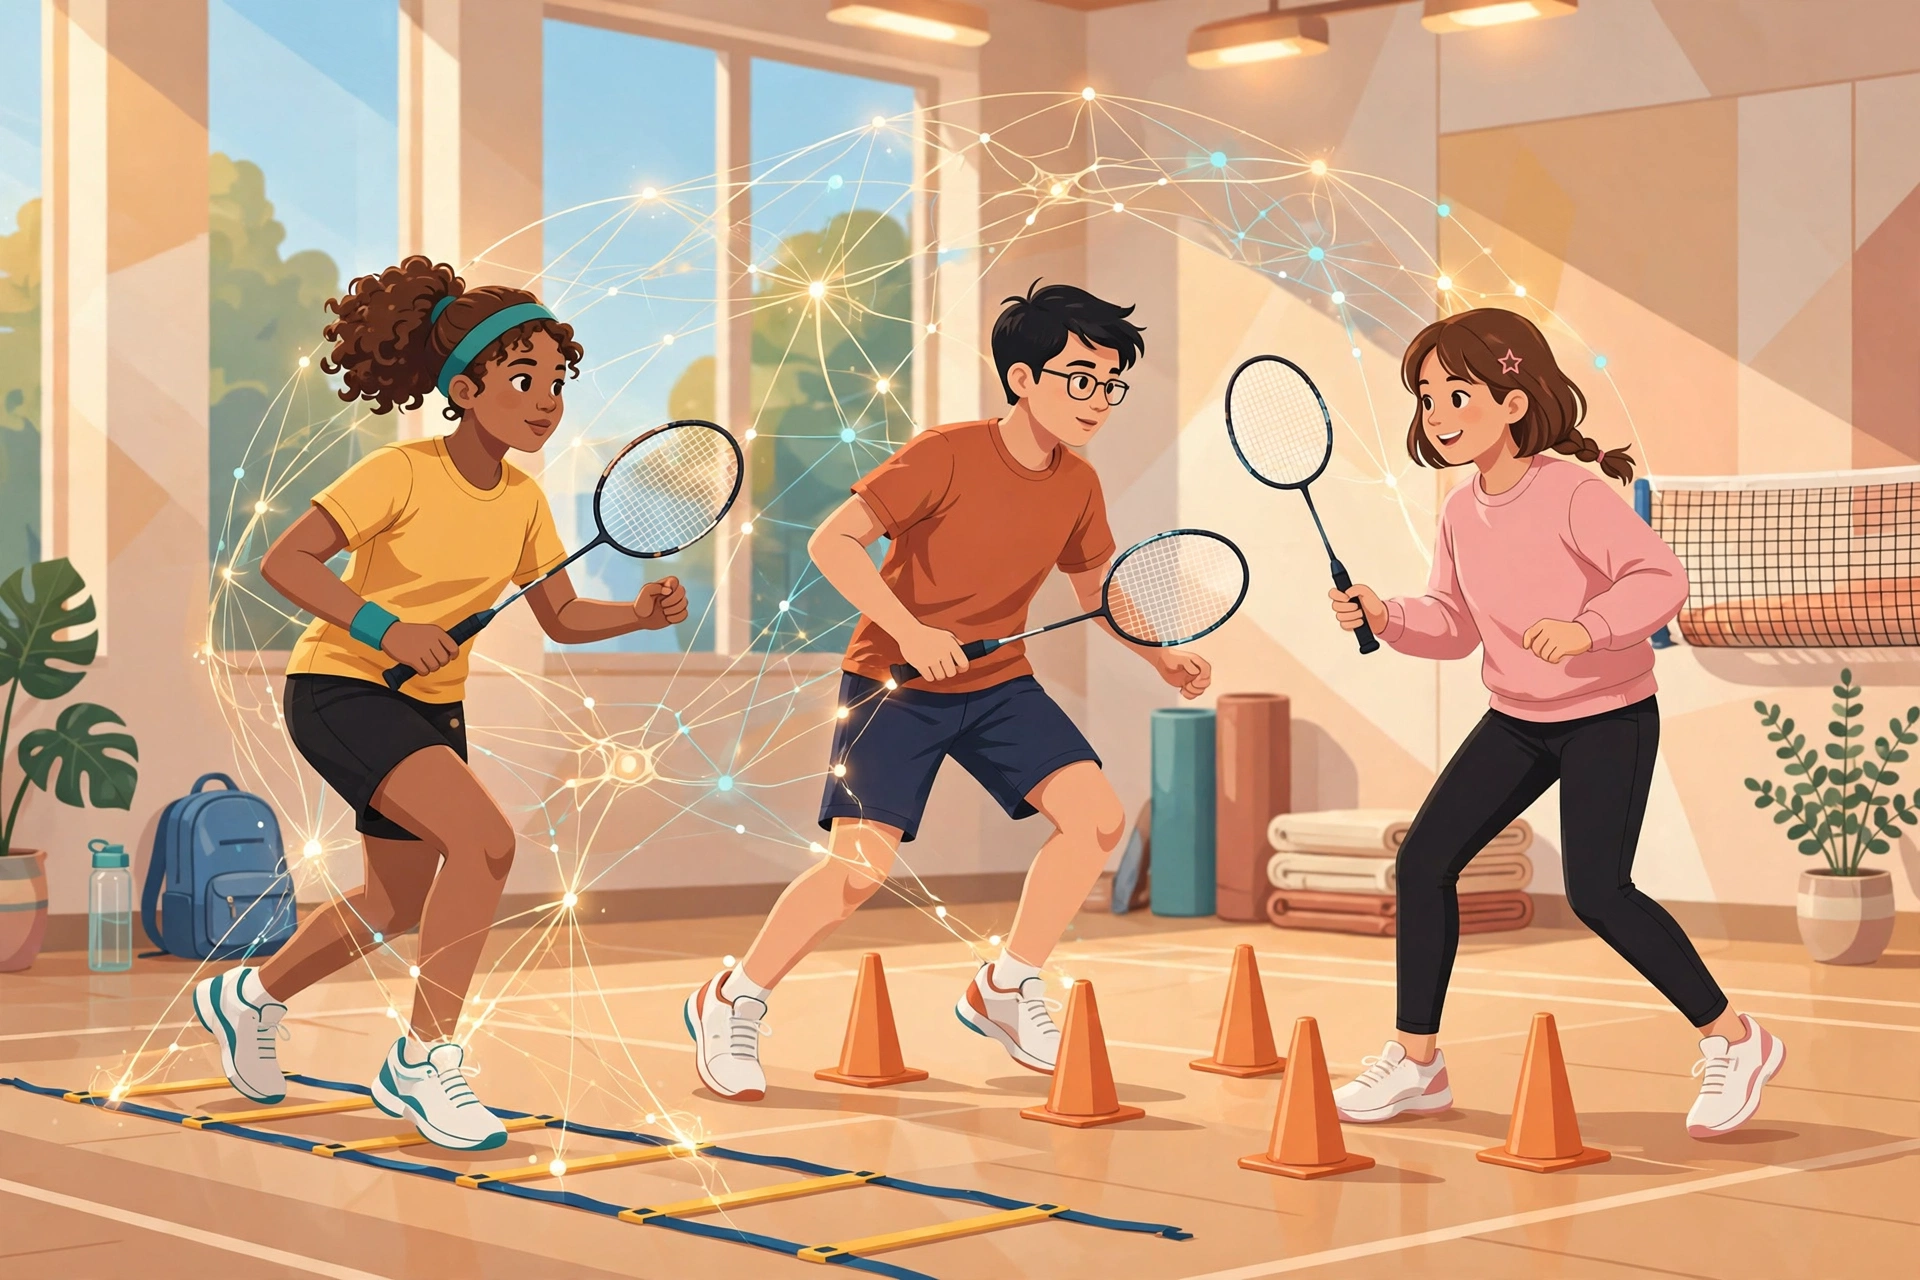
For coaches and parents, that means three iron rules. First, technique before loading: NSCA practice guidelines recommend prepubertal athletes build technique with bodyweight, wooden dowels, and 2–3 kg medicine balls, coach-to-athlete ratios no worse than 1:10, 2–3 sessions a week of 20–30 minutes. Second, neuromuscular training is a vaccine: a 2025 Sports Medicine review found systematic neuromuscular training cuts youth athletes' injury rate by 42% — the mechanism being exactly enhanced neural drive, better movement biomechanics, and sharper proprioception. Third, this stage is safe: the NSCA position statement, an international consensus endorsed by 10 authoritative bodies (Lloyd et al.), and the UKSCA/BASES statements all agree — under qualified supervision, youth resistance training (including weightlifting movements) is safe and beneficial, and even improves psychosocial wellbeing. What's dangerous was never "training strength" — it's "training blind" and "training unsupervised."
Now look back at Chapter 4's finding — pain peaking in the 2nd–3rd year of playing — and the logic closes the loop: ages 11–12 are exactly when pain incidence doubles (4.34 per 1,000 hours), and what kids this age need most is not more volume but getting the movement patterns written correctly — write the neural software wrong, and the hardware (joints, tendons) pays the debt.
From Foundation to Ceiling: Six Foundational Moves and Braking Power
Translated into movement language, LTAD conditioning is six foundational patterns: squat, hip hinge, lunge, push, pull, rotation (plus loaded carries). These aren't "gym exercises" — they're the source code of badminton movement: the lunge maps to the court's most dominant movement pattern; the hinge maps to trunk-forward power in the smash and the save; rotation/anti-rotation maps to the X-factor's trunk coil; push and pull map to shoulder-girdle balance (preventing the GIRD and shoulder injuries from the last chapter); loaded carries map to multi-directional footwork endurance.
Foundational movement quality tracks performance: Woods and colleagues found, in 44 U18 athletes, moderate correlations between overhead-squat scores and vertical jump and 20-meter sprint (rs ≈ 0.3–0.4) — movement quality and physical capacity rise together. And because childhood strength training is neurally driven, the neural adaptations from these foundational patterns transfer to jumping and sprinting more readily than machine-based training does (Children, 2020).
The most neglected piece in amateur training is braking capacity. Badminton is a sport where "the brakes matter more than the engine": a 2025 Scientific Reports 8-week intervention found "balance + plyometric" combined training significantly outperformed plyometrics alone in improving change-of-direction performance and lowering lower-limb injury risk — and change-of-direction speed correlates with match win rate at r = −0.83 (Tiwari et al.). Another study found that in repeated deceleration tasks, maximal eccentric strength (not concentric) determined how well braking capacity held up: the drop-off in early-phase braking correlated only with eccentric strength (IJSPP). In training language: eccentric squats, flywheel work, and dedicated deceleration drills deserve a seat at your program's table.
| Foundational move | What it maps to on court | Cost of getting it wrong |
|---|---|---|
| Lunge | Net play, defense, recovery — the court's most dominant movement | Too little knee flexion → ACL load spikes |
| Hinge | Forward-leaning power in the smash, the save, landing absorption | All lumbar compensation → low-back pain |
| Squat | Low defensive stance, baseline stiffness for the jump | Knee valgus → patellofemoral wear |
| Rotation / anti-rotation | The X-factor trunk coil — the engine of shuttle speed | Can't rotate → the shoulder works overtime |
| Push / pull | Shoulder-girdle balance — preventing GIRD and shoulder injury | All push, no pull → lost internal rotation |
| Loaded carry | Multi-directional footwork endurance, late-game stability | Footwork falls apart late → unforced errors |
The Gearbox: Two Portraits of the Energy Systems
The riddle of badminton conditioning: it looks explosive, but it's really an aerobic-based, anaerobic-ignited hybrid. The mix ratio, though, has two competing portraits in the literature — worth hanging side by side.
The classic portrait (Faude 2007, Phomsoupha 2015): roughly 70% aerobic + 30% anaerobic, with the lactate component minor — average match heart rate above 90% of max, average blood lactate 4.4 mmol/L. The logic: the ATP-PCr system fires every shot, while the aerobic system's real value is rapid recovery between rallies — resetting the CP stores so the next shot can still go full power.
The three-component portrait (Fu et al., 2021): using PCr–lactate–oxygen-consumption indirect calorimetry, oxidative supply 94.2%, phosphagen 4.4%, glycolysis just 1.4%. The disagreement is methodological: the three-component model attributes most of excess post-exercise oxygen consumption (EPOC) to oxidative recovery, while the classic method infers from in-match physiology. The field hasn't settled this — I hang both portraits here so you see science as it really is: numbers argue, and methods decide conclusions.
Junior field data is more concrete: 10 high-level English junior boys in simulated match play averaged 151±12 bpm (82% of max heart rate), oxygen uptake at 62% of VO₂max, post-match blood lactate 3.33 mmol/L; rallies averaged 5.7 seconds, rests 11.2 seconds (Green et al., Sports, 2023). A rally-to-rest ratio of about 1:2 — and rest length directly sets metabolic load: in a multi-shuttle feeding study, with total work held equal, stretching the rest from 10 to 50 seconds drove blood lactate from 3.6 to 7.3 mmol/L (Edel et al.). So when you design interval training, "how long to rest" matters exactly as much as "how hard to hit."
Aerobic capacity's greatest value in badminton isn't letting you "never get tired" — it's letting you reload the ammunition (the CP stores) for the next shot inside a 15-second break.
For Parents of Young Players: Every Dollar Should Buy Athletic Lifespan
The first eight chapters were for coaches and trainers. This one is for you — the one spending tens of thousands a year on your child's classes.
I know your two biggest fears: getting hurt, and falling behind at school. But few parents ask the third question: what exactly is the money buying? Better movement patterns — or more class hours, earlier specialization, fuller weekends? The data's answer may differ from your gut.
Chart one: pain incidence doubles at ages 11–12
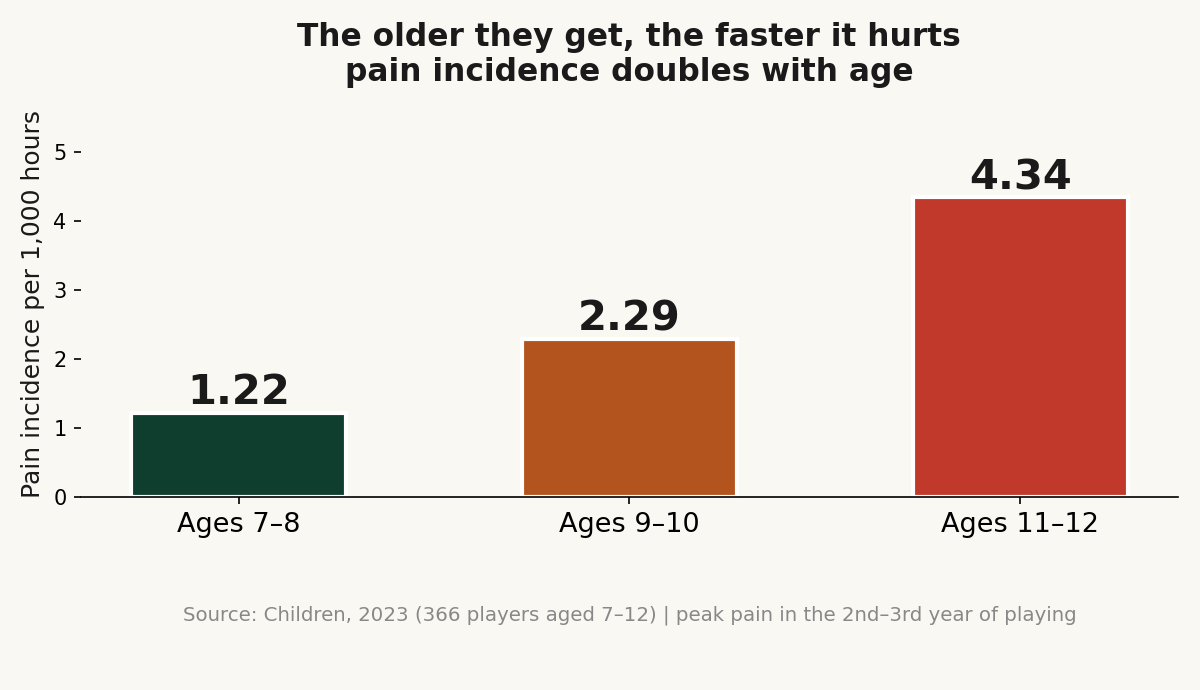
Read this chart and you've understood half of youth injury. It's not that kids are "fragile" — it's that intensity rose and technique didn't keep up. The same study found that in every age group, kids in their 2nd–3rd year of playing hurt the most — the window where training crosses from "learning technique" into "competing": volume spikes, contact intensity spikes, and the movement patterns aren't written right yet. Translated into a judgment parents can use: the semester your child starts complaining regularly about knees and ankles is usually not "not training enough" — it's "growing too fast, loaded too hard."
Chart two: the cheapest "injury vaccine" is sleep
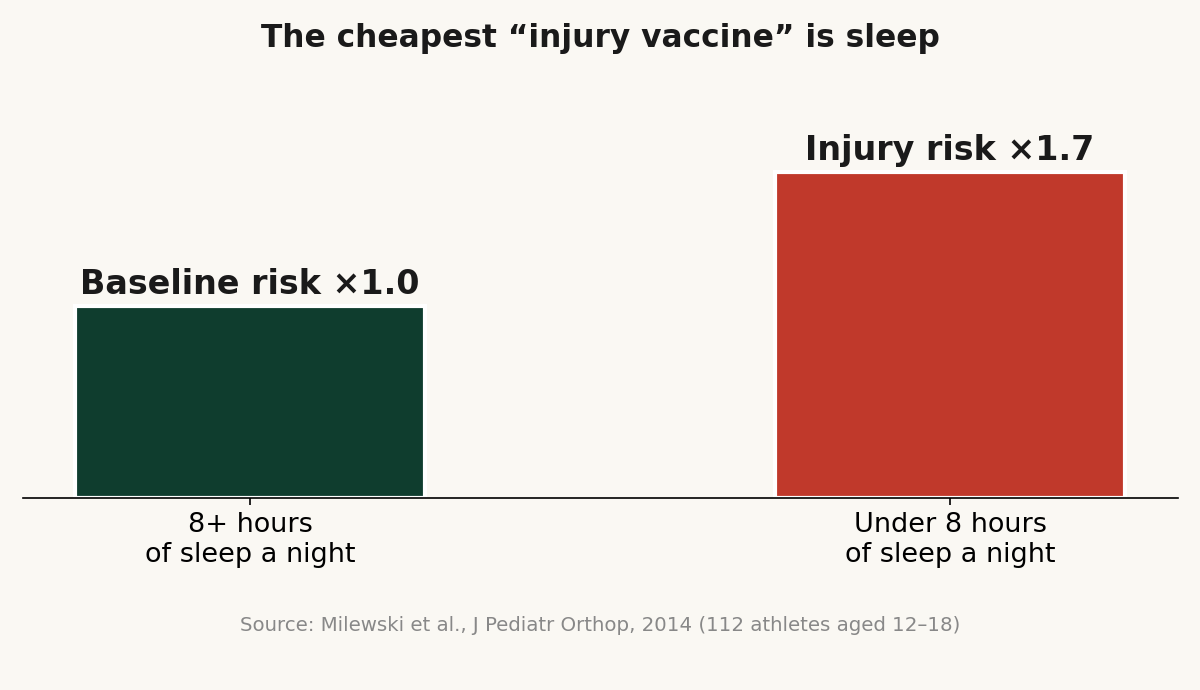
Milewski and colleagues studied 112 athletes aged 12–18 and found: averaging under 8 hours of sleep a night carries 1.7× the injury risk of sleeping 8+ hours; put the other way, kids who sleep enough get hurt 68% less. Note this: in that study, how much they trained, private lessons or group classes — none of it predicted injury as strongly as sleep did. So when you're debating "one more evening session," ask first: can my child get 8 full hours tonight? If the answer is no, that session is buying injury, not progress.
The real "vaccine" costs one hour a week
A 2025 Sports Medicine review gave parents the best deal in the catalog: systematic neuromuscular training cuts youth athletes' injury rate by 42%. And what does it look like? The NSCA practice guidelines spell it out — 2–3 sessions a week, 20–30 minutes each, bodyweight, a wooden dowel, a 2–3 kg medicine ball — training movement patterns, balance, and landing technique. No expensive equipment, no scary loads. Barely over an hour a week, in exchange for −42% on the injury rate. Compare: one ACL tear means 6–12 months away from competition plus a serious medical and rehab bill. Your pick.
One more caution: don't specialize too early
Many parents believe "to make it, you have to go all-in early." The evidence says otherwise: Jayanthi's series found kids highly specialized before age 12 get hurt significantly more, independent of training volume — specialization itself is an independent risk factor; the AAP's 2016 official statement recommends delaying specialization in most sports until 15–16 (after puberty) — fewer injuries, and better odds of success. And Güllich's tracking of world champions and Olympic medalists adds the twist: the medalists were exactly the ones who specialized later and played more sports as kids. So letting your elementary-schooler play several ball games and keep free play in the schedule isn't "goofing off" — it's buying the body insurance. Jayanthi offered a rule of thumb parents can actually use: a child's weekly specialized-training hours should stay under their age — a 10-year-old, no more than 10 hours a week.
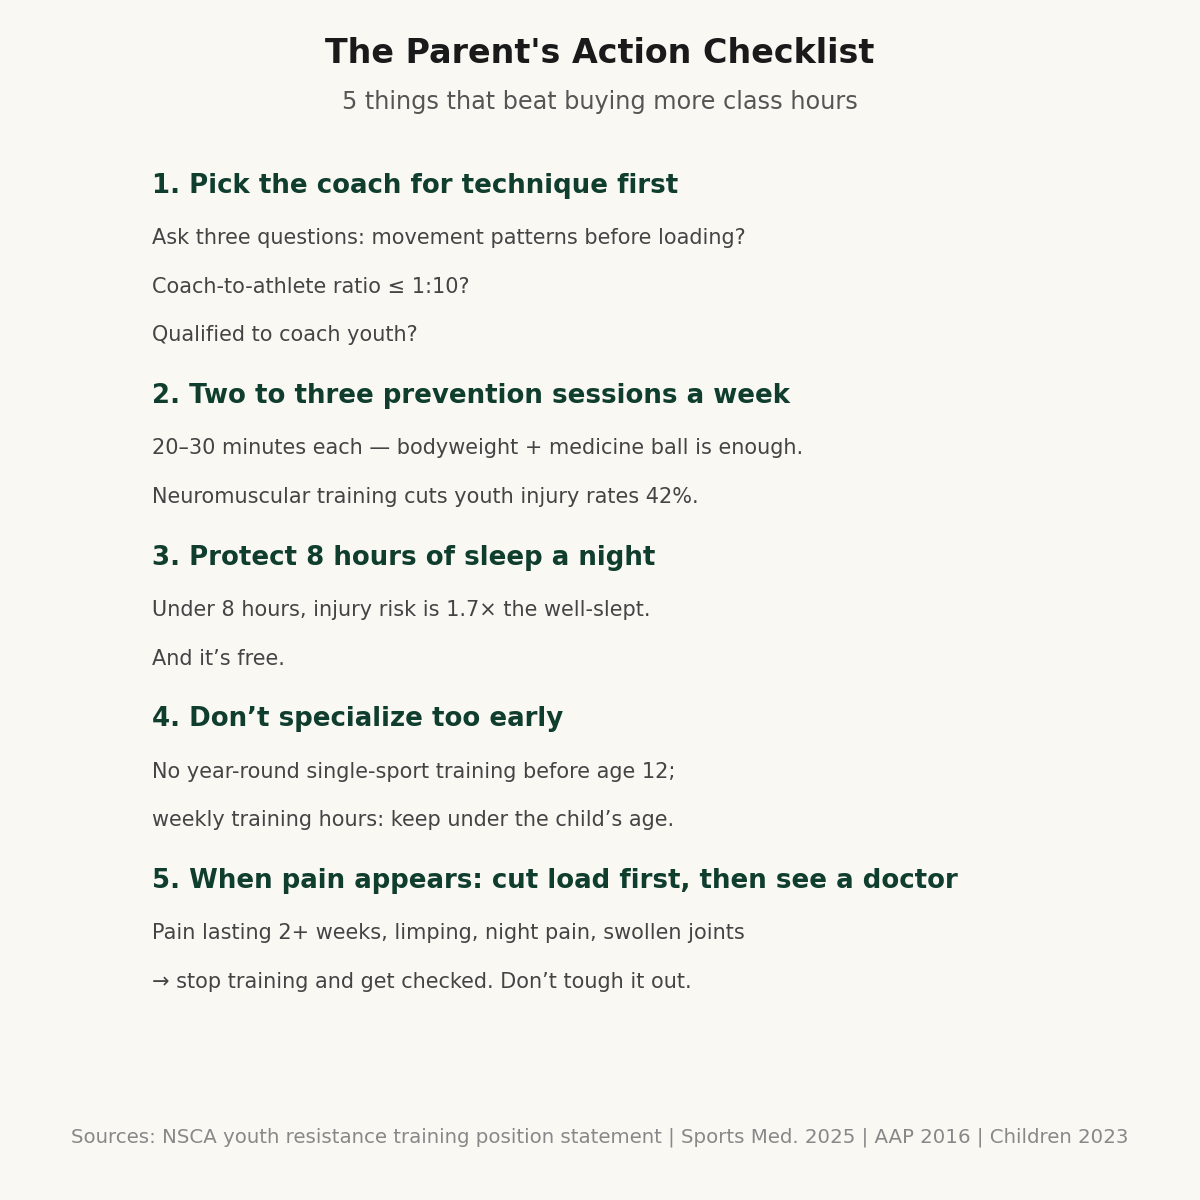
Finally, a checklist for the fridge door
Coda: Four Sentences, One Reminder
First: speed is a product of the chain, not the arm. Energy amplifies link by link from hip to wrist; behind the wrist's 1-kW peak stands the trunk's 57% contribution and the four-tenths of shuttle-speed variance the X-factor explains. Train the smash — train the whole chain.
Second: injuries are bills, not accidents. Every 2×-body-weight footstrike, every knee-dominant braking action, is being entered in the ledger. Lower-limb injuries at 41%–92%, pain incidence doubling at 11–12 — the bill always comes due; the only question is whether you prevent on purpose or pay by default.
Third: for kids, writing software beats stacking hardware. Strength gains at U11–U13 come from neural adaptation; neuromuscular training cuts injuries 42%; technique always ranks ahead of loading. This stage's goal isn't "stronger" — it's "moves better."
Fourth: parents — buy athletic lifespan, not class hours. Pain incidence doubles at 11–12, under-8-hours sleep raises injury risk 1.7×, specializing too early moves you further from the podium, not closer. Every dollar should go to "movement patterns written right" and "the body given time to recover."
One last reminder: this essay fuses training guidelines with the newest 2023–2026 research, but the causal chain "weak legs/core → compensatory shoulder and elbow injury" remains mechanistic inference, and the energy-system ratios carry a methodological dispute — science's honesty is precisely in marking its boundaries. Next time, a completely different world.
◆
References
- King M. et al. A Correlational Analysis of Shuttlecock Speed Kinematic Determinants in the Badminton Jump Smash. Appl. Sci. 2020, 10(4):1248.
- Rasmussen J. et al. Analysis of segment energy transfer using musculoskeletal models in a high speed badminton stroke. Proc. 9th Int. Symp. Computer Methods in Biomechanics, 2010.
- Teu K.K. et al. Using dual Euler angles for the analysis of arm movement during the badminton smash. Sports Eng. 2005.
- Phomsoupha M., Laffaye G. The science of badminton. Sports Med. 2015, 45(4):473–495.
- Shoulder strength vs. shuttlecock speed in U11 players. J. Funct. Morphol. Kinesiol. 2026, 11(3):360.
- Effects of direction and gender on lower limb biomechanics during forward lunges. BMC Sports Sci. Med. Rehabil. 2025.
- Machine learning prediction of ACL loading during the wide lunge. Front. Bioeng. Biotechnol. 2026.
- Electromyographic analysis of muscle contribution across stroke techniques. Appl. Sci. 2026, 16(2):1120.
- Systematic review on badminton injuries. BMJ Open Sport Exerc. Med. 2025, 11(1):e002127.
- Pengked K. et al. Badminton-related musculoskeletal injuries in senior players. Electron. J. Gen. Med. 2025.
- Dhawale et al. Injury epidemiology in youth badminton: a scoping review. Front. Sports Active Living 2026.
- Badminton-related pain in pre-adolescent players. Children 2023, 10(9):1501.
- Zhou X. et al. Shoulder pain risk vs. physical fitness in badminton players. BWF Development, 2024.
- Shoulder muscle imbalance as injury risk factor (prospective). Phys. Ther. Sport 2023.
- Faigenbaum A.D. et al. Youth resistance training: updated position statement. NSCA, J. Strength Cond. Res.
- The era of resistance training in youth. Sports Med. 2025.
- Ford P. et al. The LTAD model: physiological evidence and application. J. Sports Sci. 2010.
- Green R. et al. Physiological responses of junior badminton match play. Sports 2023, 11(2):35.
- Balance+plyometric vs plyometric in young players. Sci. Rep. 2025.
- Higher eccentric strength mitigates deceleration decline. Int. J. Sports Physiol. Perform. 21(8).
- Milewski M.D. et al. Chronic lack of sleep is associated with increased sports injuries in adolescent athletes. J. Pediatr. Orthop. 2014, 34(2):129–133.
- Myer G.D., Jayanthi N., DiFiori J.P. et al. Sport specialization, part I: does early sports specialization increase negative outcomes and reduce the opportunity for success in young athletes? Sports Health. 2015, 7(5):437–442.
- Brenner J.S. et al. Sports specialization and intensive training in young athletes. Pediatrics. 2016, 138(3):e20162148. (AAP official statement)