 拾光
拾光 Gleanings Series · 007 | By Heisenberg
Where Does Clubhead Speed Come From
The science of golf strength and conditioning, reconstructed
Contents
- Prologue: Ask the Right Question First
- Distance Is the First Currency
- Chapter 1: What Physical Capacities Does Golf Actually Demand?
- Chapter 2: The Biomechanical Truth of the Swing — Ground, Sequence, and Rotation
- Chapter 3: What Determines Clubhead Speed — A Panorama of the Evidence
- Chapter 4: Does Training Actually Work? The Verdict of Intervention Studies
- Chapter 5: Mobility and Screening — An Admission Ticket, Not a Predictor
- Chapter 6: Back Pain and Load — Golf's Dark Side
- Chapter 7: What to Measure, How to Measure — The Toolbox
- Chapter 8: The Training Plan — From Evidence to Practice
- Epilogue
- Writer's Note
- References
Prologue: Ask the Right Question First
Almost every serious golfer has asked a strength coach the same question: so how should I actually train?
The answers come back in every flavor. The junior golfer's parents say: stretch more, don't touch the barbell, it'll stunt your growth. The weekend warrior says: run three times a week — if your conditioning holds, your back nine won't collapse. Strength Coach A says: light weights, high reps, rotate the medicine ball, don't get hurt. Strength Coach B says: train the golfer like a strength athlete — squat, deadlift, go heavy. And come tournament week, everyone suddenly agrees: don't train at all. Rest up. Don't let soreness ruin your feel.
In 2023, I wrote an essay called *What Is Golf Strength and Conditioning?*, trying to end the chaos with a simple trick: stop arguing about *how* to train, and first answer *what this sport actually demands of the body*. Work backward from the demands to the training. Three years on, the skeleton of that essay still holds.
But the flesh is entirely new.
Between 2024 and 2026, three systematic reviews and meta-analyses in *Sports Medicine* turned golf S&C from a battle of opinions into a battle of evidence. Some claims that had circulated for twenty years were executed on the spot by the data. Some details nobody paid attention to turned out to be the real gold mines.
This essay is a rewrite of that 2023 piece. The skeleton is inherited; the evidence is all new; and more than a few of the conclusions are counterintuitive.
"Clubhead speed is the speed at which you push the ground away."
That is the thesis line of this entire essay. By the end, you'll know it's not a figure of speech.
Distance Is the First Currency
*Before answering "how to train," answer a more fundamental question: what is the actual status of physical training in this sport?*
Golf has always held two extreme views of S&C. One says: golf is a skill game; conditioning is the cherry on top — just look at the era when big bellies could win on tour. The other says: conditioning decides everything; if you don't lift, don't dream of hitting it far.
Both are wrong — but asymmetrically wrong. The evidence points to a clear conclusion: in golf, distance is the first currency, and the primary factor of production for distance is the body.
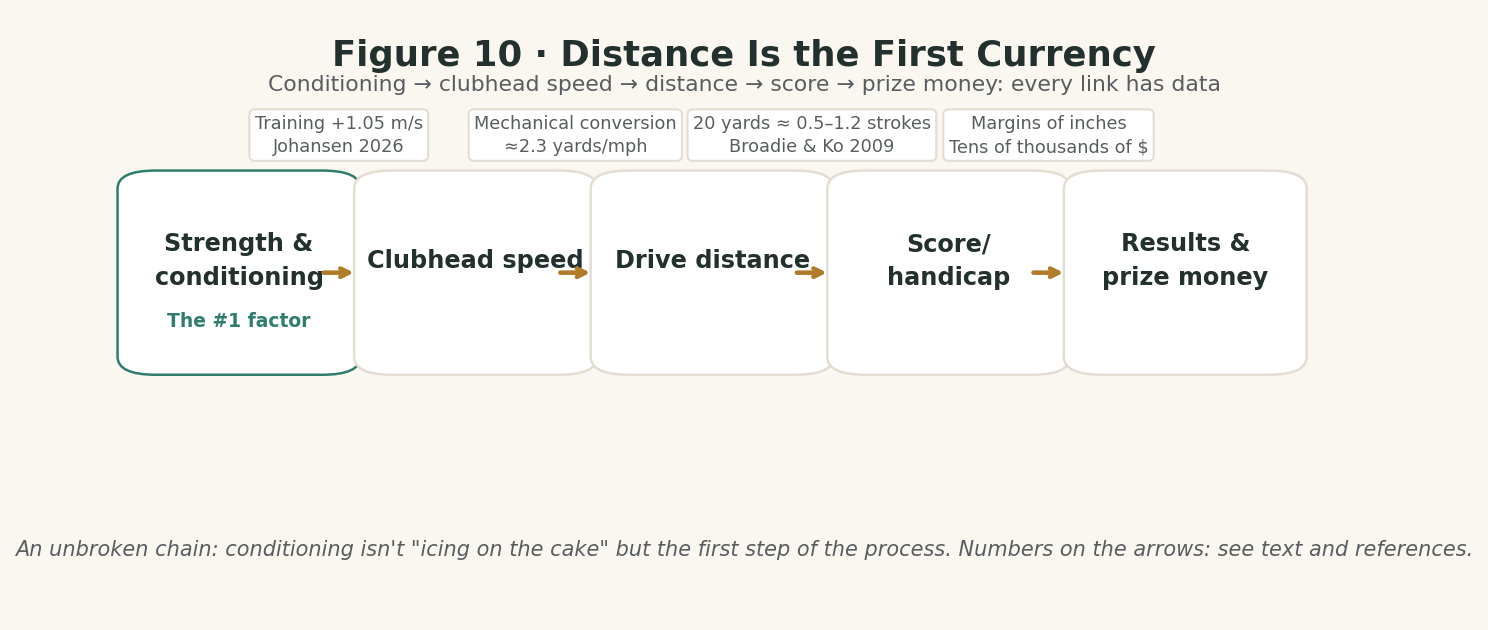
Follow the chain: S&C → clubhead speed → driving distance → score → earnings and trophies. Every link in the chain has data behind it.
Link one: S&C raises clubhead speed. Johansen et al.'s 2026 meta-analysis (33 studies, 798 golfers): systematic training produced an average of +1.05 m/s of clubhead speed and +9.33 m of carry. The GRADE certainty rating is low — but the direction is unanimous: across thirty-plus studies, not one points the other way (see Chapter 4).
Link two: clubhead speed converts into distance. This is pure mechanics. The launch-monitor industry's rule of thumb: every 1 mph of clubhead speed is worth roughly 2.3–2.5 yards of carry (TrackMan's figure; the exact number floats with strike efficiency).
Link three: distance converts into score. Broadie's Strokes Gained framework is the cornerstone here: every additional 20 yards of driving distance (with directional accuracy held constant) saves roughly 0.5–1.2 strokes per round — about 1.2 for the 100-shooter, about 0.5 for the 80-shooter (Broadie & Ko 2009, a simulation study; media-reported tour figures put it near 1.4). An honest note is owed here: Broadie's system was built on PGA Tour ShotLink data, and "distance crushes everything" is the media-amplified version — in the original analysis, the gaps in each part of the game contribute far less lopsidedly than the popular slogan suggests. But the direction has never been overturned, and there's good reason to believe that for amateurs, whose dispersion is wider, the weight of distance only grows.
Breaking the numbers down by handicap gives a "distance-to-score" translation table. Read the fine print before reading the table:
- Every number below rests on the assumption that directional accuracy does not change — with the same angular error, distance converts cleanly into strokes. The moment added distance comes with added dispersion, the gains get discounted (see the new section in Chapter 3, "Does Swinging Faster Mean Swinging Crooked?").
- The +10-yard column is a linear interpolation, not directly reported by any measurement or simulation; "saves ≈X strokes" is a change in expected score, not a promise.
| Handicap | +10 yards saves ≈ | +20 yards saves ≈ | Basis |
|---|---|---|---|
| ~28 (shoots ~100) | ~0.6 strokes | ~1.2 strokes | Peer-reviewed (Broadie & Ko 2009 simulation, typical course); +10-yard column inferred |
| ~20 (shoots ~95) | ~0.9 strokes | ~1.8 strokes | Media reporting (Broadie / Golfmetrics analysis, GOLF.com); +10-yard column inferred |
| ~10 (shoots ~80) | ~0.25 strokes | ~0.5 strokes | Peer-reviewed (Broadie & Ko 2009 simulation, typical course); +10-yard column inferred |
| Professional | ~0.7 strokes | ~1.4 strokes | Media reporting (Broadie / Golfmetrics analysis, GOLF.com); +10-yard column inferred |
Two boundaries that don't fit in the table:
- For the 95-shooter tier: counting the knock-on effect of shorter approach clubs, the author's own extrapolation puts total gains at 3.6+ strokes — the author's calculation, not measured data.
- The Ichikawa n=28 between-group regression (+2.2 mph of clubhead speed ↔ 1.5 fewer strokes on average) is a cross-sectional between-group comparison, not causal — roughly +5 yards of carry ↔ −1.5 strokes — and should not be converted directly into this table.
Distance is the first currency, no question. But this table is its exchange rate — and the rate holds only if your directional accuracy doesn't depreciate.
Link four: score converts into prize money. In professional golf, the margin between fortunes is measured in millimeters. Media outlets once cited Broadie's team's estimate: 20 extra yards of driving is worth about $180,000 a year (GOLF.com's 2020 reporting of the figure — not a peer-reviewed paper; cite the nature of the source when quoting).
Beyond the chain, two independent lines of evidence confirm that conditioning is no cherry on top.
First: the sport is "athleticizing." The R&A and USGA's annual distance reports show tour average driving distance rose about 5% (14 yards) from 1980 to 2005, then went essentially flat after 2005 (governing-body reporting, not peer-reviewed research). With the equipment dividend spent, the remaining distance has to be mined from the body — today's tour players squat, deadlift, and throw rotational medicine balls as a matter of routine. The "golf athlete," a freak show ten years ago, is now standard issue.
Second: conditioning is an insurance policy for showing up. Williamson et al.'s 2024 review (20 studies, 9,221 golfers): professional golfers carry a 73.5% lifetime injury/illness prevalence, amateurs 56.6%; pros face 3.05 times the back-injury risk of the general population. And a cross-sport meta-analysis shows strength training cuts sports-injury risk by roughly a third (Lauersen et al. — note: this is cross-sport evidence; golf-specific injury-prevention RCTs are nearly nonexistent, see Chapter 6). The other side deserves a hearing too: McHardy et al.'s 2007 warning that golfers who did *only* golf-related strength training — no other training types — actually got hurt more (OR=2.7, 95% CI 1.6–4.6; the authors' own reading was overuse, or that this kind of training is useless-to-harmful for the swing). S&C is both medicine and poison — the difference is whether it's done scientifically.
So this essay's position can be stated in one sentence: S&C is not golf's "supporting act"; it is the first station on the distance assembly line. The eight chapters that follow take that station apart, component by component, and examine the evidence for each.
Chapter 1: What Physical Capacities Does Golf Actually Demand?
Before answering "how do you train for it," take the sport apart and look at what it actually asks of the body. This is deduction: start from the sport itself and work out the capacities it demands. No training school gets a head start — facts only.
Time Structure: A Five-Hour Round Built from Forty Sub-Second Explosions
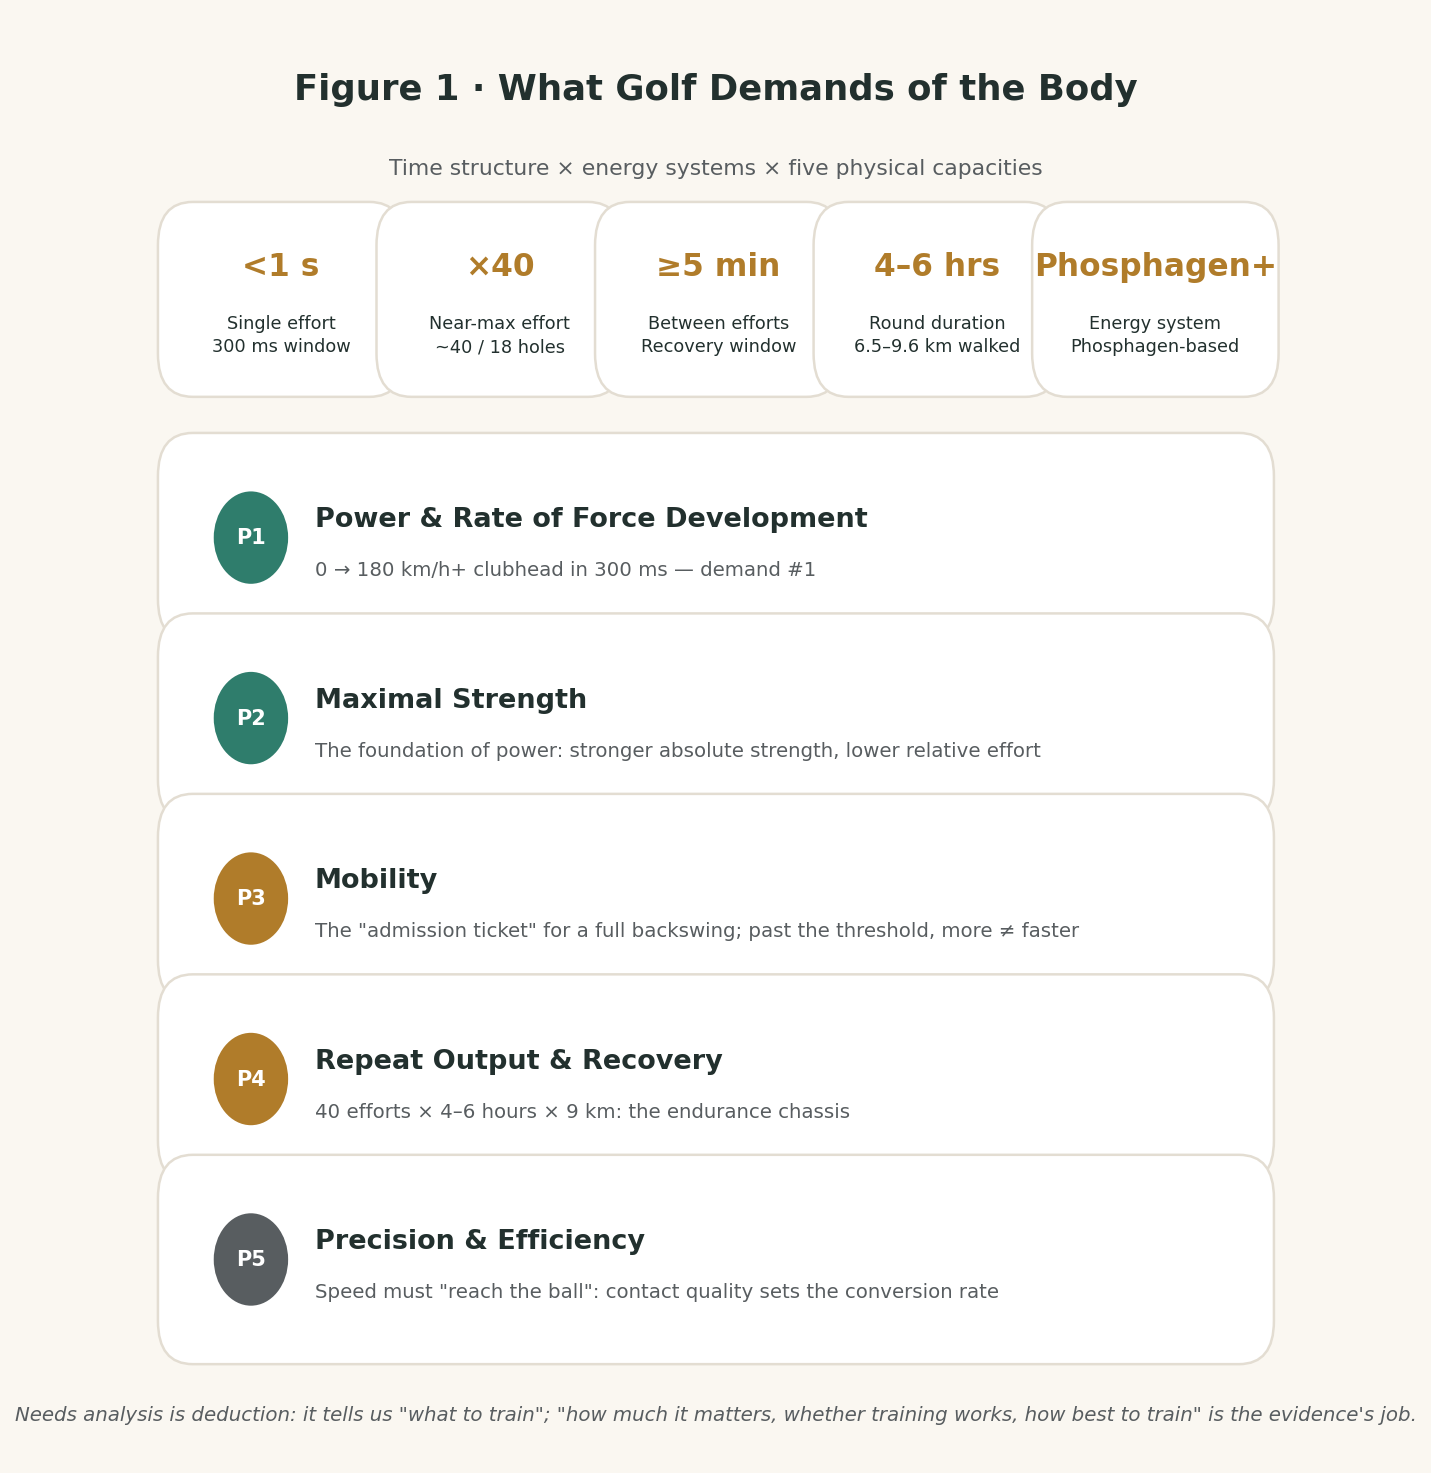
A complete golf swing, from takeaway to follow-through, takes under two seconds. The downswing — the part that actually decides how far the ball goes — takes under one. The window in which power is truly delivered is really only about 300 milliseconds.
Inside that sliver, a PGA Tour player swings the clubhead at an average of roughly 115 miles per hour (about 185 kilometers per hour); the LPGA average is about 96 mph (Tour data cited in Johansen et al., 2026). Peak hip-rotation velocity approaches 500 degrees per second; the thorax spins at roughly 650–720 degrees per second (measured on Tour players by Cheetham et al.).
Then comes the long wait. Between two full-effort swings: at least five minutes — walking, waiting on the group ahead, reading the green, picking a club. Over 18 holes, that adds up to roughly 40 maximal or near-maximal efforts, scattered across four to six hours. Along the way, 6.5 to 9.6 kilometers on foot (9.6 being the upper end of the commonly cited estimates), with almost never more than 300 yards of continuous walking — walk a stretch, stand around for two or three minutes, walk the next stretch.
Translated into physiology, that timetable reads like this: a single swing is dominated by the phosphagen system (roughly 95% of its energy from ATP–CP, with glycolysis contributing little), with generous recovery windows between bursts; the four-to-six-hour round rests on an aerobic base — the aerobic system contributes almost nothing at the instant of the swing; its job is recovery between efforts and keeping you from falling apart by hole 18.
That verdict is the master switch for everything that follows. Two examples of why. First, why isn't "three 30-minute jogs a week" on the recommendation list? Because the swing's output barely calls on the aerobic system — jogging trains an energy system the swing doesn't use, so the demand doesn't match and the training lands in the wrong place (its proper role is in Chapter 6: a health investment, not a speed builder). Second, why does "a five-minute plank" never make the priority list? Because the swing asks for 300 milliseconds of trunk rotational power, while the plank trains static endurance — the right address, the wrong time scale. That's the value of a needs analysis: it's a sieve that throws out the wrong directions before you ever argue about dosage.
The Five Physical Capacities
From that timetable, you can derive the five physical capacities golf demands. Note the order — it *is* the priority ranking:
First, power and rate of force development. In 300 milliseconds, take the clubhead from zero to over 180 kilometers per hour. That's the first demand, and the hardest to train, and the most talent-hungry. Note the phrase: *rate of force development* — not how much you can lift, but how fast you can deliver it.
Second, maximal strength. The foundation under power. Take two people with the same rate of force development, one squatting 60 kilos and one squatting 140: the second produces more absolute power. Strength also determines *relative effort*: the stronger you are in absolute terms, the smaller the fraction of your capacity each swing costs — the movement holds its shape better, and the injury risk drops.
Third, mobility. A full backswing arc, internal and external hip rotation, thoracic rotation — these are the admission ticket. Without them, power has nowhere to express itself, and the body patches the missing range with compensation (lumbar side-bend, for instance). Compensation charges interest.
Fourth, repeated output and recovery. Forty explosions, four to six hours, plus nine kilometers on foot. Single-burst power and "what fraction is still there on swing number 36" are two different things.
Fifth, conversion rate. The first four manufacture speed; this one cashes it in. Here, stated formally, is the governing formula of the entire essay:
Distance = clubhead speed × conversion rate
Conversion rate is impact quality: smash factor, face control, launch angle. (An honest footnote: the formula is written conceptually; the strict physical chain runs clubhead speed → ball speed (smash factor) → distance (launch angle, spin) — "conversion rate" bundles everything downstream of clubhead speed.) The division of labor is clean — S&C training moves only the first half; technique decides the second. Clubhead speed rises while ball speed doesn't, and the gain is wasted. The reverse holds too: distance can rise with clubhead speed flat, so long as conversion rate rises (Parker's 2017 nine-week trial is exactly that case — see Chapter 4, "The Transfer Gap").
Treat that formula as the coordinate system for everything ahead: every "did the training work?" discussion that follows is a claim about one half of it.
The Limits of Deduction
Needs analysis is a good starting point, but it has an honest limit: it's deduction, not evidence.
It can tell you *what* to train, but it can't answer three harder questions: how important is each of these five capacities, and in what order? If you train them, does ball speed actually rise? Among the ways to raise ball speed, which works best?
Deduction can't touch those three. Only intervention studies and data can. The seven chapters ahead are the 2024–2026 evidence's answers — and a few of them will surprise you.
Chapter 2: The Biomechanical Truth of the Swing — Ground, Sequence, and Rotation
Where is clubhead speed actually *manufactured*? Instinct says: the arms, the shoulders, the torso. But a systematic review published in *Sports Medicine* in 2026 (Watson et al., synthesizing 24 studies) gave a counterintuitive answer: a substantial share of clubhead speed is borrowed from the ground.
You Push the Ground Away; the Ground Pushes It Back Into the Clubhead
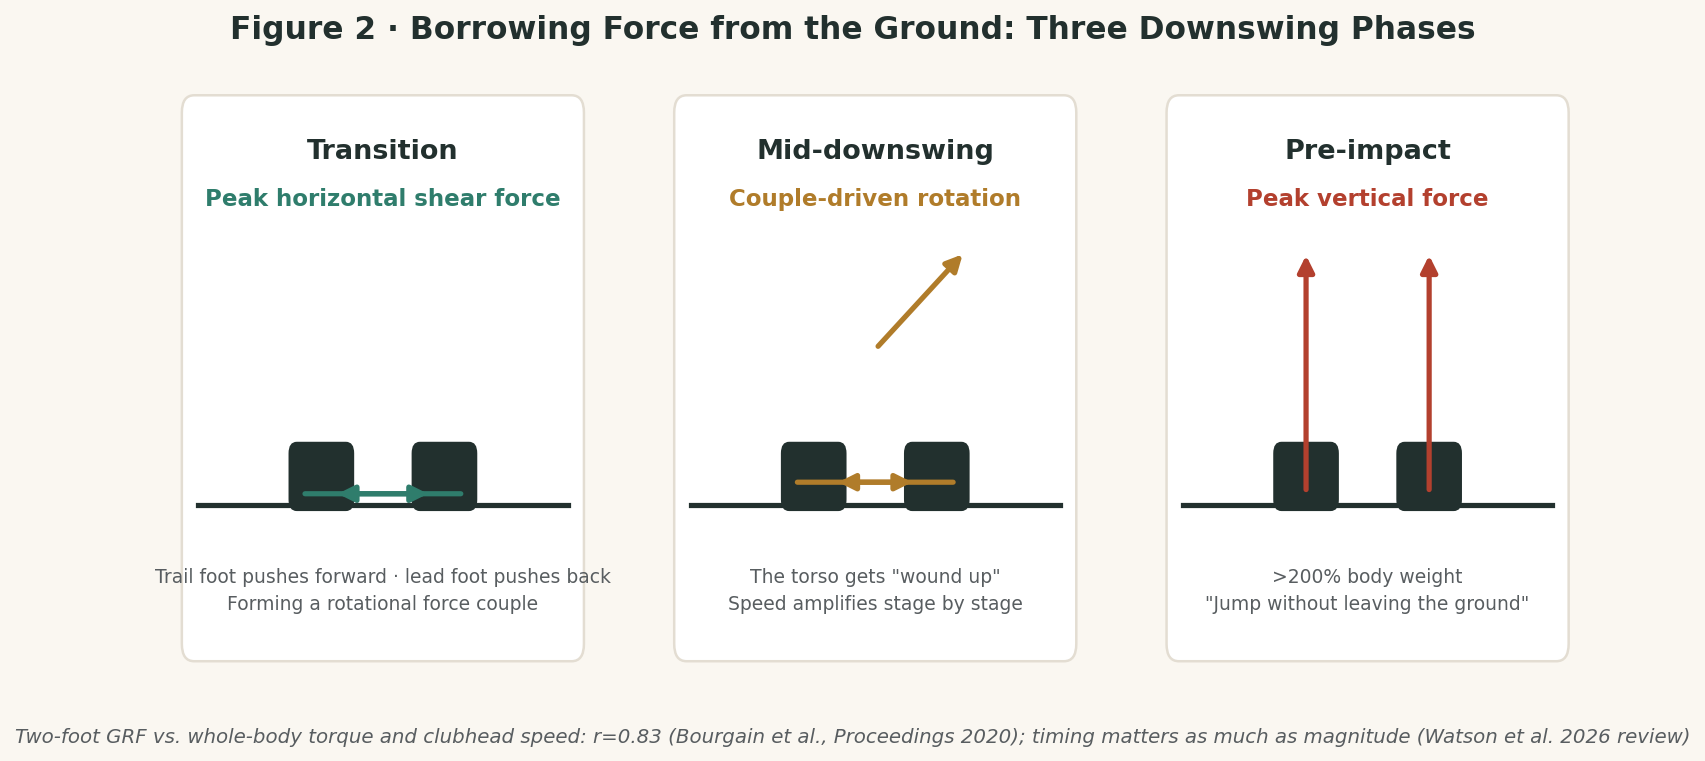
Throughout the swing, the feet and the ground trade force continuously — the ground reaction force (GRF). The review found that 9 studies reported moderate-to-strong associations between ground reaction force and clubhead speed. The headline number comes from Bourgain et al. (*Proceedings*, 2020): the resultant moment of the two feet's ground reaction forces about the body's center of mass — the "motor moment" — correlated with clubhead speed at r = 0.83. Note what that is: not one foot, not a single directional component, but the total rotational effect of both feet's forces on the center of mass. The same study found no strong correlation for any individual GRF component.
Pause for what that number means. A correlation coefficient r runs from −1 to 1: the closer to 1, the more reliably the two rise together; above 0.8 is very strong, around 0.5 is moderate, near zero is no relationship. In sport science, 0.83 is a rarity.
Another study in the synthesis (Williams, a mixed-handicap sample) reported peak horizontal ground reaction force correlating with clubhead speed at r = 0.69 — the original paper could not be independently verified; the figure is cited from the review, so flag that when citing it. The review's conclusion was unambiguous: both the magnitude and the timing of ground forces matter — it's not about shoving harder, it's about shoving on time.
The picture runs like this: at the transition (the instant the backswing turns into the downswing), horizontal force peaks first — the trail foot pushes forward, the lead foot pushes back, forming a force couple that rotates the torso; then vertical force peaks just before impact, topping 200% of body weight in elite long drivers — a jump that never leaves the ground. That is where this essay's opening aphorism comes from: clubhead speed is the speed at which you push the ground away.
One more number in passing: the spine absorbs roughly 8 times body weight in compressive force during the swing. That's why the back is golf's number-one injury zone — Chapter 6 takes it apart.
The Kinetic Chain: Sequence Is Description, Not Prescription
"Proximal-to-distal sequencing" is the most-cited biomechanical concept in golf instruction: in the downswing, the pelvis turns first, then the thorax, then the arms, then the club — velocity handed down like a cracking whip. Cheetham et al. (2008) confirmed it: tour professionals consistently show the sequence, while amateurs routinely "arm-race" — firing the arms before the thorax.
But there's a twist. Kwon laboratory data show that within already-skilled players, the peak-velocity instants of each segment actually bunch within 14 milliseconds of each other, the order varying by individual; and more importantly, the correlation between the "order" of peak arrival and clubhead speed is only r = 0.05–0.10 (essentially zero), while what actually correlates is the peak *velocity* of each segment itself (r = 0.58–0.70).
In plain terms: kinetic-chain sequencing distinguishes professionals from amateurs, but in someone who already knows how to swing, obsessing over "did my pelvis lead by five milliseconds?" is meaningless — what matters is making each segment rotate faster. Sequence describes the phenomenon; it doesn't write the prescription. Using "sequence" to guide a skilled player's training is mistaking the map for the territory.
X-factor: The Coronation and the Debunking of a Metric
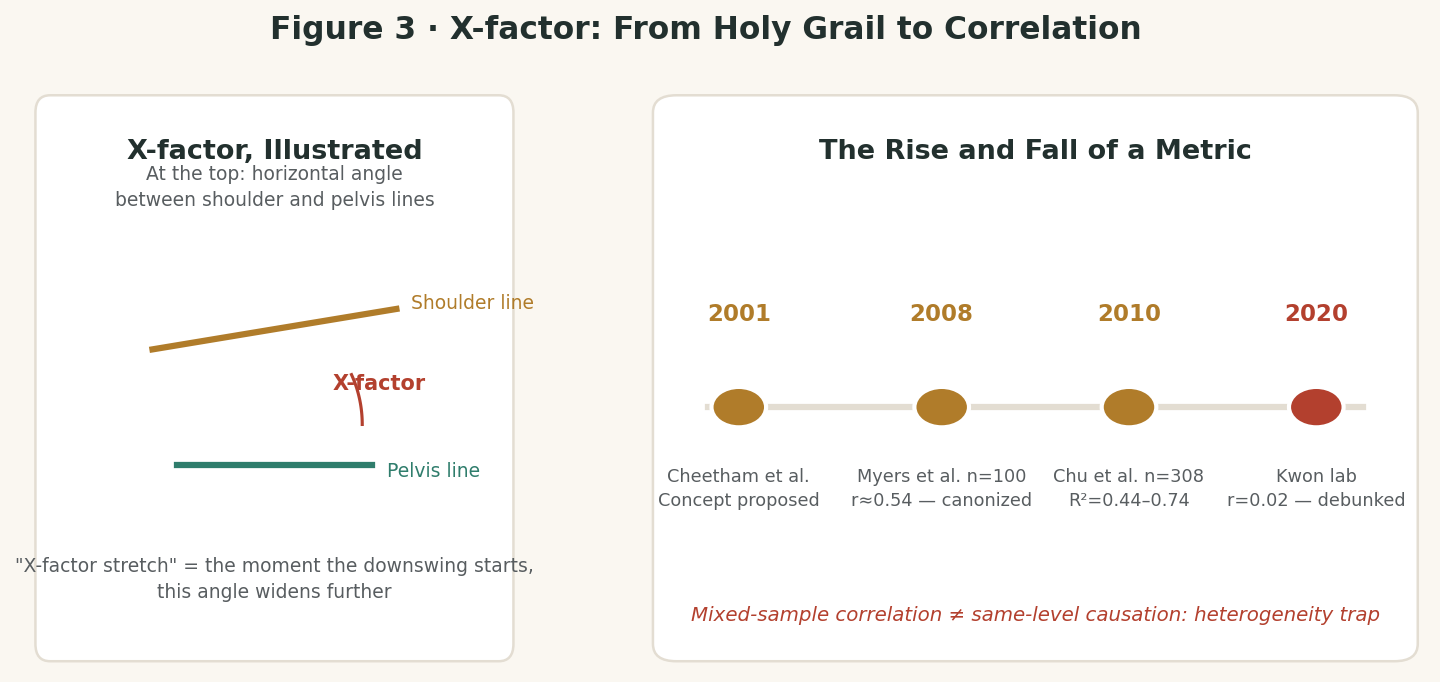
The X-factor — the horizontal rotational gap between shoulders and pelvis at the top of the backswing — may be the most famous single metric in golf biomechanics. In 2001, Cheetham et al. proposed the "X-factor stretch": the pelvis starts the downswing first, the shoulders lag, and the gap stretches wider — cocking the torso like a rubber band to manufacture a stretch–shortening cycle.
In 2008, Myers et al. found X-factor correlating with ball speed at r ≈ 0.54–0.55 across 100 players; in 2010, Chu et al. reported R² of 0.44–0.74 in a 308-player sample. X-factor was canonized, becoming the holy grail of countless instructional systems: "Increase your X-factor, hit it farther."
Then the Kwon laboratory took it apart: in skilled players, X-factor stretch amplitude correlated with clubhead speed at r = 0.02 — essentially zero; top-of-backswing X-factor at r = 0.18, maximum X-factor at r = 0.16, both meaningless. An earlier study had reported no significant X-factor difference between professionals and amateurs, but that finding is contested — Zheng et al. (2008) found significant differences between professionals and high-handicap groups.
How do you explain the contradiction? The heterogeneity trap: Myers's and Chu's samples mixed players of different skill levels and speeds, so the correlation likely came from *between-group* differences (better players just happened to have bigger X-factors) rather than "X-factor causes speed." Compared within a single skill band, the effect vanishes. X-factor is a correlate, not a causal lever — and deliberately "wringing" out a bigger X-factor comes at a spinal price (over 7 times body weight in compression; see above).
Chapter 3: What Determines Clubhead Speed — A Panorama of the Evidence
Chapter 1 laid out five physical capacities. Now, Brennan et al.'s 2024 systematic review and meta-analysis in *Sports Medicine* — twenty studies pooled together — gives them a priority ranking. This is the most important chart in the entire article, worth reading line by line.
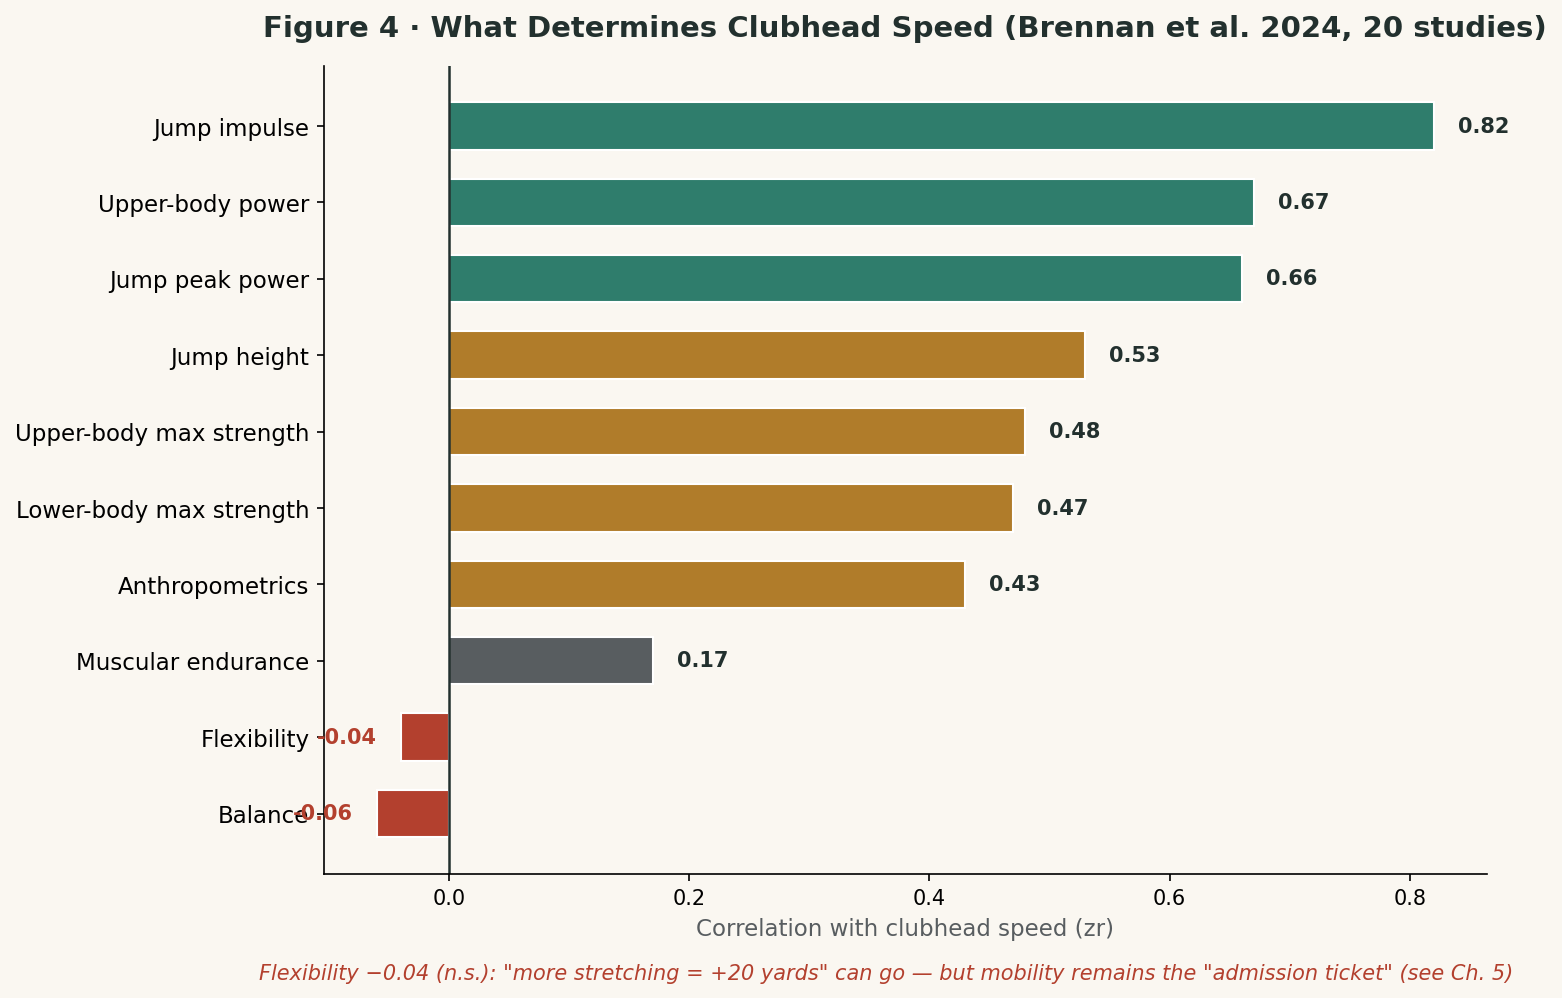
Ranked by strength of correlation with clubhead speed (zr, interpreted like r), from strongest to weakest:
- Jump impulse: 0.82 — in a league of its own. Impulse is force × time: it measures exactly how much propulsive output you can deliver inside a limited window.
- Upper-body explosiveness: 0.67; jump peak power: 0.66 — close behind.
- Jump height: 0.53; upper-body maximal strength: 0.48; lower-body maximal strength: 0.47 — moderate. Strength matters, but it ranks below explosiveness.
- Anthropometry (height, reach, body mass, etc.): 0.43 — moderate. Body type has an influence, but it is far from decisive.
- Muscular endurance: 0.17 — weak.
- Flexibility: -0.04; balance: -0.06 — statistically non-significant; essentially zero.
Read this chart three times. Explosiveness / rate of force development > maximal strength > body type > endurance — and flexibility and balance have essentially no relationship with clubhead speed.
The End of "Flexibility Is Everything"
This is the most jarring conclusion in the whole article — and a direct verdict on decades of collective belief in the golf industry.
"Golfers need to stretch more" — "you can't hit it far without flexibility" — this line of thinking ruled golf conditioning for at least twenty years. Stretching, private coaching sessions, yoga: how much training time went into all of it? The pooled evidence of 20 studies says: the correlation between flexibility and clubhead speed is -0.04, statistically indistinguishable from zero. An earlier study by Gordon et al. (2009, 15 golfers with handicaps ≤ 8) found the same: chest strength r=0.69, rotational power r=0.54 — while trunk flexibility was non-significant.
Mind the evidence boundary: this kills the causal chain "flexibility → more distance," not the idea that mobility matters. Chapter 5 will give it its proper place — the "admission ticket." But the equation "more stretching = 20 more yards" can be burned.
Differences Between Sexes, Differences Between Levels
A 2026 study by Johansen et al. in the *Scandinavian Journal of Medicine & Science in Sports* looked specifically at elite players. Among elite men, the strongest correlate of clubhead speed was trunk rotation peak power (r=0.89), followed by vertical jump impulse (0.78); among elite women, the strongest was jump impulse (0.67).
Among women, height (0.51) and body mass (0.49) correlated more strongly than in men, suggesting body type carries somewhat more weight in the women's game — training expectations should be set separately (there's a women's section in Chapter 8).
One more gender difference worth savoring, from Robinson et al.'s 2023 women-specific meta-analysis: among women golfers, the correlation pattern of clubhead speed with strength (r=0.54), lower-body power (0.60), and upper-body power (0.56–0.57) looked much like men's — except that flexibility's correlation with clubhead speed reached 0.52–0.71, while in the male-dominated Brennan 2024 meta-analysis it was non-significant (-0.04). Is this a genuine sex difference, or noise from a tiny sample (just 3 studies, one with questionable methodology)? There is no answer yet — flag it as an open question. But at minimum it warns us: copying data from male players straight onto female players is laziness.
Why Clubhead Speed Is Hard Currency
Fradkin et al.'s 2004 classic: 5-iron clubhead speed correlated with handicap at r=-0.95 (the lower the handicap, the faster the swing). In golf, distance is the ultimate cheat code — an extra 10 yards off the tee means one less club into the green on the second shot, which means higher greens-in-regulation rates and lower scores. Every "how much was gained" discussion that follows can be folded into that one sentence.
Does Hitting It Faster Mean Hitting It Crooked?
"Swinging harder just scatters it more" is the most stubborn intuition in amateur golf. It's half right and half wrong — and the half it's wrong about is that it mashes two different questions into one.
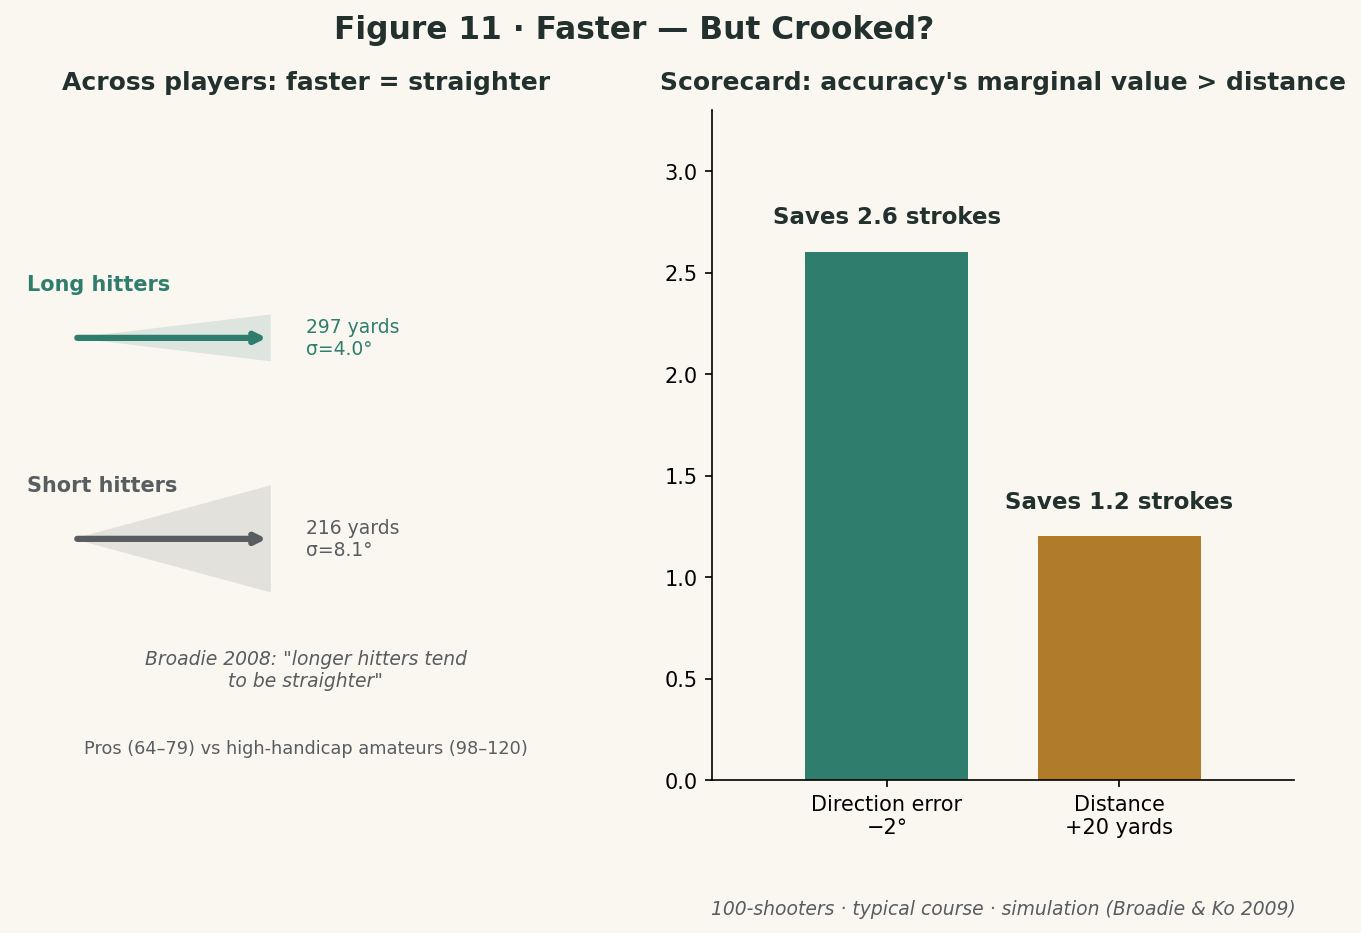
Across players: the long hitters are actually straighter. Broadie 2008, analyzing the Golfmetrics database (~40,000 shots, 130+ players, 6 courses, pros and amateurs included): driving distance correlated negatively with directional error — in the abstract's own words: "longer hitters tend to be straighter than shorter hitters." The pro group: directional-error standard deviation 4.0°, average distance 297 yards; the high-handicap amateur group (98–120): 8.1°, 216 yards — pros were roughly "twice as straight." Mind the mechanism: this is a cross-player comparison — people with good overall technique are better at both things. There is no "swinging harder makes you straighter" here, and no causal claim can be reversed out of it [B]. A Japanese study (n=28) in which each player hit 15 drives saw the same picture: the skilled group (average 74.6) vs. the amateur group (94.2) — clubhead speed 48.8 vs. 41.6 m/s, face-angle standard deviation across the 15 swings 1.1° vs. 2.3° — "fast and square." But that is a cross-sectional between-group comparison, the journal details were never verified (self-archived author version), and "1.5 strokes saved per 1 m/s faster" is just a between-group regression coefficient, not a causal promise [C].
Within a player: the same person swinging recklessly harder really does scatter it. This is geometry: hold the angular error fixed, and the farther the ball flies, the wider the absolute landing dispersion. In Broadie & Ko's 2009 simulation, +20 yards under a constant-angular-error assumption actually dropped fairway hit rate by about 4% — precisely the mechanism by which dispersion eats into the distance gains. A 2025 media test (not peer-reviewed, n=2, ten balls per effort level each, outliers removed) offers an intuitive illustration: a +2.4-handicap player at 100% effort vs. a 70% swing — carry 303 vs. 255 yards, landing dispersion 25 vs. 11 yards. Fun to look at; not evidence.
On the scorecard: for amateur players, the marginal value of accuracy outweighs distance. From the same simulation (Broadie & Ko 2009, a typical course): for a 100-shooter, +20 yards (accuracy held constant) ≈ 1.2 strokes saved; a 2° improvement in directional error (fairway hit rate +10%, roughly 43%→53%) ≈ 2.6 strokes saved. For an 80-shooter: +20 yards saves 0.5 strokes, 1° saves 1.1. Two qualifiers must be stated plainly: this is a simulation, not a measured intervention; and it is highly course-dependent — on a treeless (but still watered, bunkered, thick-roughed, OB-lined) course, a 100-shooter's +20 yards ≈ 2.0 strokes saved while a 2° improvement ≈ 1.7, and distance pulls back ahead. In the authors' own words: "When there is less trouble, distance becomes relatively more important than accuracy." [B]
The conclusion should be read together with "transfer": when S&C raises your clubhead speed (without deforming your swing), you are migrating into the population of "long and straight" — that's the cross-player category; swinging wildly harder is the within-player category, where dispersion will eat some of the gains. So the definition of "transfer" needs to be expanded: not just from the gym to clubhead speed, but from clubhead speed to *usable* distance — distance with directional accuracy held constant.
The Evidence Boundary: Correlation Is Not Causation
Full disclosure: this chapter is almost entirely cross-sectional correlation studies. Correlations tell us "the good players all happen to be explosive," but they cannot answer "if I make you more explosive, will your ball speed rise?" That belongs to intervention studies — next chapter.
What Golfers Can Do:If you're willing to do just one test, make it the vertical jump (CMJ). It is the simplest measure of this chapter's strongest predictor (impulse r=0.82): a phone in slow-motion plus a mark on the wall is enough. Test for four weeks running — if your training isn't raising your vertical jump, it probably isn't raising your clubhead speed either.
Chapter 4: Does Training Actually Work? The Verdict of Intervention Studies
Correlation studies answer "who's faster"; intervention studies answer "does training make you faster." In March 2026, Johansen et al. published a systematic review and meta-analysis of golf training interventions in *Sports Medicine*: 33 studies, 798 golfers. This is the most authoritative answer currently available to the question "does strength and conditioning actually do anything for golf performance?"
The conclusion first, then the numbers: it works, but modestly. Manage expectations first, then talk methods.
The Honest Numbers
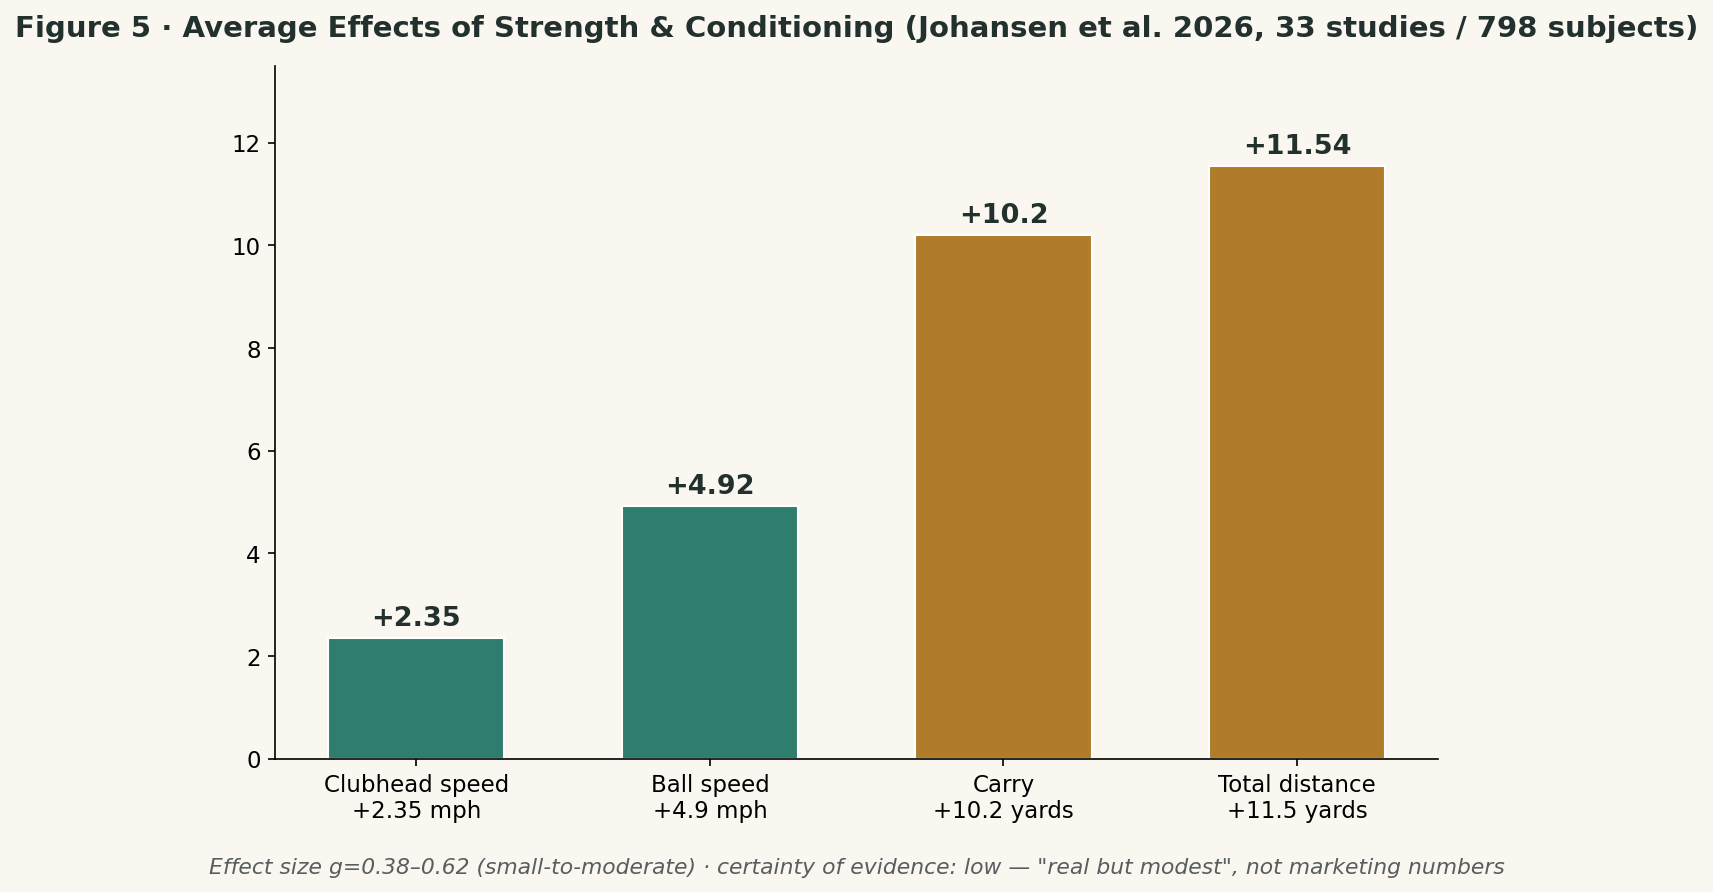
Across studies with a control group, the average gains from S&C training were: clubhead speed +1.05 m/s (≈2.35 mph), ball speed +2.20 m/s, carry +9.33 m (≈10.2 yards), total distance +10.55 m. Standardized effect sizes g ranged from 0.38 to 0.62.
A word on g (effect size): it is the standardized magnitude of an intervention's effect — 0.2 counts as small, 0.5 as medium, 0.8 as large. So 0.38–0.62 is "small-to-medium" — real, but no transformation.
And one thing that must be said: the certainty of the evidence was rated "low." Meaning: the effect is probably real, but better studies in the future may revise the numbers. Anyone selling lessons off "+10 yards" can stop; anyone saying "S&C is useless" is also wrong. The truth is in the middle, leaning toward "useful."
What Combination Works Best
Uthoff et al. 2021, in the *Journal of Strength and Conditioning Research* (a review of ~20 studies), answered "how to train": general S&C combined with golf-specific training averaged +4.1% clubhead speed and +5.2% shot distance (d≈0.51–0.52), significantly better than general S&C alone.
This is a key methodological conclusion: squats and deadlifts lay the foundation; rotational explosiveness, medicine balls, and golf-specific power work handle the "currency exchange" — converting gym strength into swing speed. Train general S&C without the specific work, and you've earned money but never exchanged it.
Landmark Trials, in Sequence
- Lephart et al. 2007 (JSCR): 8 weeks of golf-specific training — amateur golfers gained +5.2% clubhead speed and +7.7% carry. An early landmark in golf S&C interventions — but it had no control group, just pre-post measurements in one cohort, so the gains cannot be separated from "being studied" effects; discount accordingly.
- Shaw et al. 2024 (JSCR): 12 weeks of progressive resistance training in elite youth golfers: isometric mid-thigh pull (IMTP) peak force effect sizes g as high as 1.29–2.06, vertical jump g≈0.7–1.05, clubhead speed/carry g=0.41–1.64. Adolescents are the most dramatic responders — a window-of-opportunity dividend.
- Bliss et al. 2015: 8 weeks of plyometric training — skilled youth golfers gained ~3% in clubhead speed and carry (a media-reported figure; the original paper reported an average club speed change of about 4 km/h). But individual responses varied widely — some gained 8%, some nothing at all.
- Hegedus et al. 2016: amateur women, traditional vs. golf-specific resistance training RCT — both groups improved; the seated medicine-ball throw was the test most correlated with driver speed and most sensitive to training — another footnote for "explosiveness > maximal strength" (sample: amateur women around 58 years old; extrapolating to younger/competitive populations needs care).
A word on youth. In Shaw et al. 2024's 12-week study, the youth golfers' strength metrics reached effect sizes g as high as 2.06 — numbers rarely seen in adult studies. Adolescence is the window for neuromuscular adaptation: the same training buys adolescents more. Which is why "kids shouldn't lift" is the most expensive piece of advice there is — it lands you precisely in the cheapest speed-gaining window. The premise, of course, being a properly supervised, progressive program — not throwing kids under a heavy squat rack.
The Transfer Gap: Strength Up, Ball Speed Flat
This section matters more than the last. Because the real answer to "does training work" hides in the studies that failed.
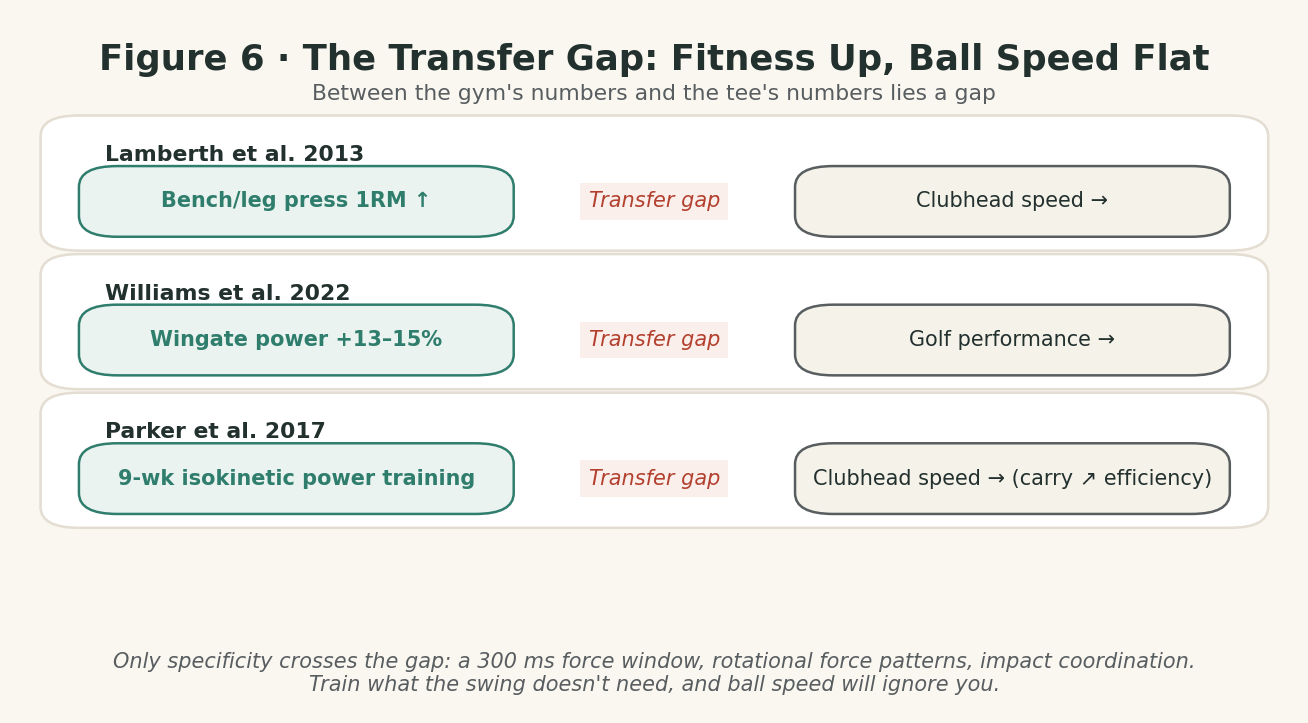
- Lamberth et al. 2013 (*Int J Golf Sci*): 6 weeks, 10 people. Bench-press and leg-press maximal strength both went up; clubhead speed didn't budge. The strength was gained but never "transferred."
- Williams et al. 2022: 3 weeks of upper-body sprint interval training. Wingate power +13–15%, ballistic bench press +6–8% — no consistent transfer to golf performance (carry +2.2%, ball speed +1.4%, basically noise).
- Parker et al. 2017: 9 weeks of isokinetic power training, 20 sub-elite golfers — neither group gained clubhead speed; carry seemed to improve (78% of participants) via better impact efficiency — the speed didn't rise, but the *conversion rate* did.
Three failures point at one word: transfer. Between the gym's numbers and the tee box's numbers lies a gap. Only specificity crosses it: a ~300 ms force-production window on the downswing, a rotational force pattern, coordination at the moment of impact — train as hard as you like, but if you aren't training what the swing demands, ball speed won't care.
In the terms of Chapter 1's formula, transfer failure comes in two shapes: strength that never became clubhead speed — Lamberth 2013: bench and leg press up, clubhead speed dead flat, the front half of the formula never cashed in; clubhead speed that never became distance — the overspeed-stick acute studies: clubhead speed +2.6 mph, smash factor down d=-0.82, ball speed flat, the back half of the formula fell off. The details of the second shape are in the next section, "overspeed training."
Overspeed Training: The Hottest Method, the Emptiest Evidence
Overspeed clubs (swinging lighter-than-normal sticks) are the hottest training fad of recent years in golf, and social media is full of "+5 mph in 6 weeks" stories. What does the evidence say?
In the peer-reviewed literature, the number of long-term randomized controlled trials of overspeed training is: zero. In the 33-study meta-analysis of 2026, there wasn't a single overspeed trial. The numbers on the market (SuperSpeed's commissioned, unpublished case study, reported by GOLF.com: 6 weeks, +5 mph clubhead speed; a non-dominant-hand-only protocol at +6.4 mph) all come from company white papers and trade media — no control groups, company funding.
The only controlled data comes from an acute study: 12 competitive golfers (handicap <3) warmed up with overspeed clubs — first-set swings gained +2.6 mph of clubhead speed, but ball speed didn't rise, and smash factor (impact efficiency) dropped significantly (d=-0.82) — and by the second set even the clubhead-speed gain was gone. In plain English: the nervous system was "tricked" into speed, but the ball didn't fly farther — because impact quality fell. Back to Chapter 1's formula: this is transfer failure's second shape — clubhead speed up, conversion rate down; the first shape (strength up, clubhead speed flat) was in the previous section's "transfer gap."
Mechanistically it makes sense (releasing the nervous system's "speed governor"), and real-world adoption is enormous. But long-term effects vs. a control group remain unproven to this day. My position: treat it as one experimental dish on the training menu — not the main course, and definitely don't take the companies' numbers as evidence.
De-mystifying Core Training
"Train more core to hit it farther" is the second great epidemic after "stretch more." The evidence: Weston et al. 2013's 8-week pure-core-training RCT (n=36, *Med Sci Sports Exerc*) — clubhead speed +3.6%; real, but small. Sung et al. 2016's 8-week core training took 60 elite golfers (handicap <3) up ~5–10% in driving distance — but the outcome was distance, not clubhead speed, and the sample was elite.
The difference isn't the "core" as a body part — it's "load" and "specificity" as variables. Planks train endurance, not power; the swing needs trunk rotational power delivered inside 300 ms. Training an endurance quality for a power demand is training the wrong energy system.
A September 2026 meta-analysis in *Life* (Liu et al., 9 trials, 220 golfers) adds the final piece of evidence to this section: the overall effect of core-inclusive S&C on clubhead speed was g=0.290 (a small, significant effect); within it, swing-simulating core training (medicine-ball rotational throws, cable chops — multi-planar rotation) subgroup g=0.451, vs. non-specific core training (planks, crunches) subgroup g=0.148 (non-significant). Two honest labels: the between-subgroup difference itself wasn't significant (p=0.252), and the GRADE rating is low/very low. So the conclusion is not "specific core training wins" — it's: whether core training works depends on how much it looks like a golf swing — specificity is the dividing line, and the dividing line itself still needs larger RCTs to confirm.
Three Good Questions for the Skeptics
Let's set up the three ugliest questions the skeptics have and knock them down ourselves. We build the target; we shoot it.
Q1: If strength went up, why didn't the handicap move?
This is the question the chapter most deserves. Smith et al. 2014 (*Int J Golf Sci*): 12 weeks of strength + mobility training in youth golfers aged 12–18 — strength metrics rose across the board (single-leg squat effect size 0.64, side bridge 0.96, modified push-up 0.71), handicap change p=0.27 — not statistically significant [B].
Don't rush to "useless." Three boundaries: first, the authors themselves admitted the study was underpowered — p=0.27 means "this study couldn't detect a change," not "no change exists"; second, handicap is the noisiest outcome measure there is — putting, short game, strategy, and weather all live inside it, and any one of them fluctuating over 12 weeks can drown out S&C's contribution; third, back to this chapter's "transfer gap": Lamberth 2013, Williams 2022, Parker 2017 — all three failed studies say the same thing — strength went up, ball speed didn't, because what was trained never "transferred." Smith 2014's protocol was light on specific transfer work, so a flat handicap is no surprise at all.
So Q1's honest answer: this study doesn't prove "strength training is useless" — it proves "strength training that doesn't solve the transfer problem can't even reach your handicap."
Q2: All this training — won't it just injure people more?
This time the evidence is split — and the split is itself the answer.
McHardy et al. 2007's survey: golfers who did only golf-specific strength training, no other kind, got injured at 2.7 times the rate of everyone else (OR=2.7, 95% CI 1.6–4.6; the authors' own explanation: overuse, or training of this kind being useless-to-harmful for the swing) [B].
Lauersen et al. 2014's cross-sport meta-analysis: strength training cut sports-injury risk by about two-thirds (RR=0.315) [B] — with the caveat that this is cross-sport evidence; golf-specific injury-prevention RCTs are nearly nonexistent.
Put the two numbers side by side and the conclusion stands up on its own: the training method decides whether it's medicine or poison. Golf-specific-only strength work = narrowed stimulus + repeated loading, and McHardy's 2.7× is the price; scientifically grounded, comprehensive strength training = medicine. That's also why this chapter keeps hammering "general + specific" and periodization — the difference between medicine and poison was never "train or not"; it's "how you train."
Q3: Can women and older players really gain?
They can — but set expectations separately (keeping Chapter 3's promise).
Hegedus et al. 2016's RCT: amateur women (average ~58 years), traditional vs. golf-specific resistance training — both groups improved; the seated medicine-ball throw was the test most correlated with driver speed and most sensitive to training [A] (extrapolation to younger/competitive populations needs care).
The older end is even more generous: Thompson & Osness 2004 (men 55–79, 8 weeks of strength + flexibility): clubhead speed +2.7%, strength +35–60%; Thompson et al. 2007 (average age 70.7): +4.9% [A]. At that age, the target isn't "gain" — it's "don't decline" — and the evidence says "don't decline" can be exceeded by a wide margin.
Three questions down, the skeptics are nearly out of ammunition. The remaining doubts are mostly variations on these three — and the answers all live inside the boundaries above.
Chapter 5: Mobility and Screening — An Admission Ticket, Not a Predictor
Chapter 3 already executed the claim that flexibility boosts clubhead speed. But don't throw out the stretching mat just yet — this chapter gives mobility an honest place to stand.
Flexibility: From "Engine" to "Admission Ticket"
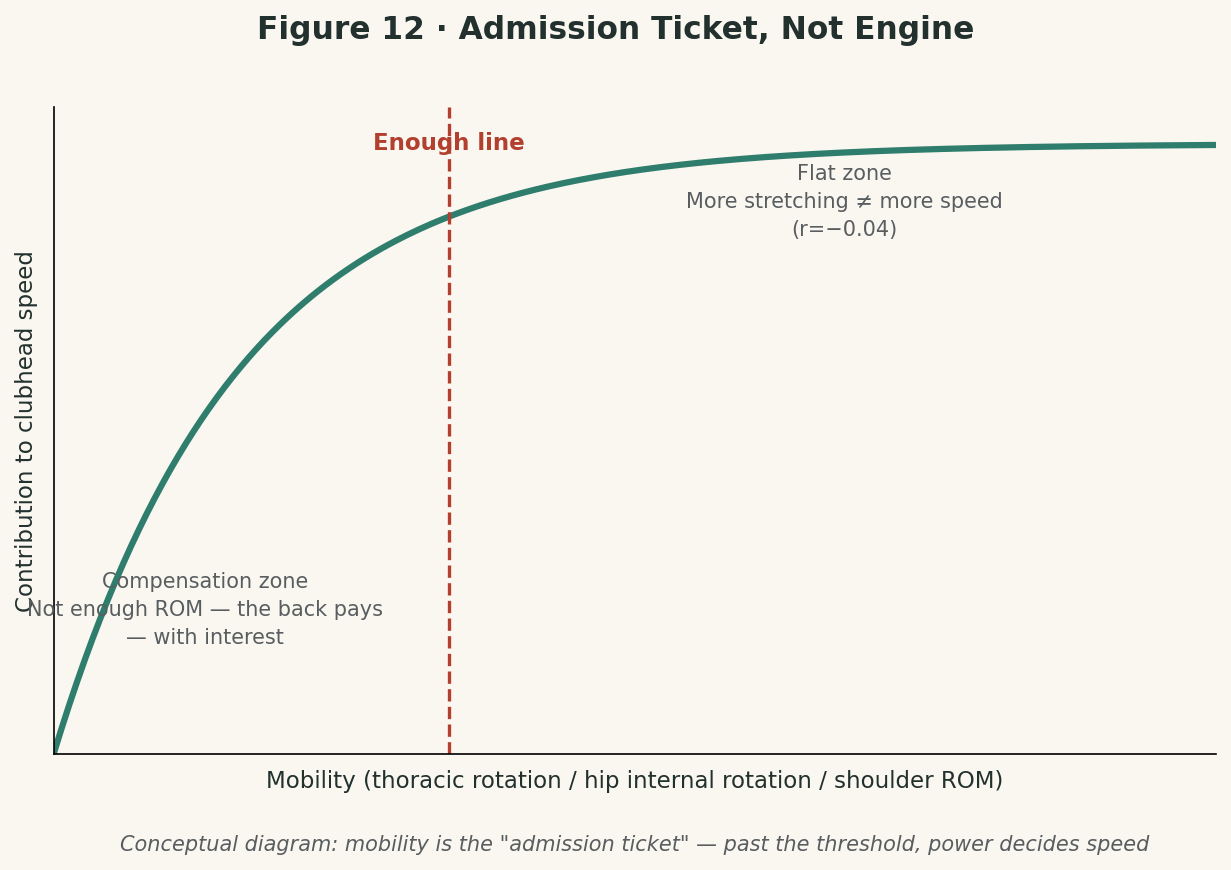
The evidence chain is clean. In Brennan's 2024 meta-analysis, the flexibility–clubhead speed correlation was −0.04 (meaningless); in Gordon 2009, torso flexibility didn't reach significance; and youth longitudinal data show something almost perverse: as athletes mature, less thoracic rotation goes with faster clubhead speed — the body learns to generate more speed with a more compact motion.
But "doesn't add speed" is not the same as "useless." The right mental model is the admission-ticket model: enough thoracic rotation, enough hip internal and external rotation, enough shoulder range of motion are the prerequisite for expressing power. Without them, the full swing can't be made, and the body has to improvise (excessive lumbar lateral flexion, for instance) — and the interest on that improvisation comes due in Chapter 6. But once you're past the "good-enough line," more mobility doesn't predict faster clubhead speed.
One sentence: mobility decides whether you *can* make the motion; power decides how *fast* you make it. Don't mistake the admission ticket for the engine.
Screening: If It Can't Predict Injury, Don't Claim It Can
Movement screening — FMS, TPI screens and the like — is standard procedure in the golf S&C world: measure a battery of joint ranges and stabilities, then tell you where you're restricted and where you're likely to get hurt. In 2023, Quinn and colleagues, writing in the *South African Journal of Physiotherapy*, put that promise to a direct test in a prospective study: 41 elite young men, a 30-test screening battery, six months of follow-up — 41% developed low back pain; of the 30 tests, only 3 distinguished the future-LBP group from the healthy group, and all of the effects were weak. Conclusion: screening cannot effectively identify golfers at risk of back pain.
It gets worse: TPI's 16-item screen has, to this day, no published peer-reviewed validation study — it has neither been validated as a predictor of injury nor as a predictor of clubhead speed. Many of its claims (that thoracic restriction causes early extension, say) are reasonable inferences inside a practitioner's framework, not controlled evidence.
That doesn't make screening useless. Following Bahr (2016) and the IOC's position, the defensible use of screening is profiling: understanding an athlete's starting point, individualizing training content, and building a shared language between coach and player. Screening is a personalization tool, not a crystal ball. Claiming that "screening can tell you who will get hurt and who will swing fast" goes beyond what the evidence allows.
What Golfers Can Do:A mobility self-check against the "good-enough line" (act only if something is clearly restricted — no need to meet gymnast standards): can you deep-squat with hips below knees and heels on the ground; is seated thoracic rotation left-right symmetric and reasonably ample; does supine hip internal rotation reach roughly 30 degrees on each side. Past the line, give the time back to power training.
Chapter 6: Back Pain and Load — Golf's Dark Side
The faster the clubhead, the steeper the bill. Golf is one of the most lopsided sports there is: single-sided, rotational, repetitive. And the bill, more often than not, is mailed to the lower back.
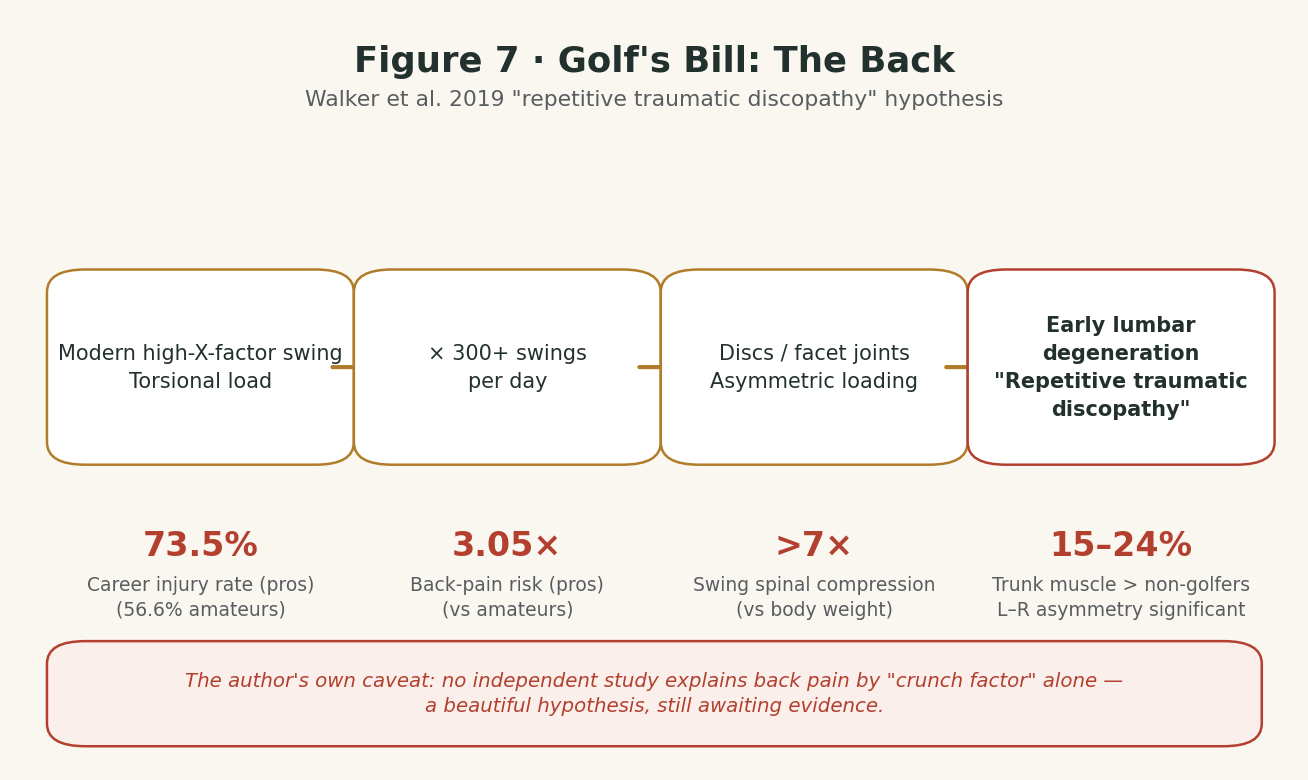
Start with a cross-sport invoice. One professional swing loads the lumbar spine with roughly 7,584 N of compression — about 8 times body weight [C]. An NFL lineman driving into a blocking sled takes 8,679 N [C]. And in cadaver studies, disc herniation occurs at roughly 5,500 N of compression [C]. Lined up side by side, the three numbers say: a golf swing's lumbar compression is on the same order of magnitude as a lineman's full frontal hit, and a single peak already exceeds the empirical herniation threshold. The difference is only this: the lineman gets to rest after one hit; the golfer "takes" 300-plus of them a day, each a three-punch combo of rotation, compression, and lateral flexion. That's why Walker and colleagues titled their 2019 *Journal of Neurosurgery: Spine* paper "Golf: a contact sport" — golf was never non-contact; it just books every one of its contacts against the lumbar spine. (Boundaries: the 7,584 N comes from Hosea et al.'s model estimate, on a sample of just 4 professionals; the 5,500 N is an empirical cadaver value, with some sources citing a ~5,800 N variant; these are single-peak loads, and injury is the cumulative product — you cannot work backward from this to "one swing will herniate a disc.")
The Numbers: The Lower Back Is Injury Zone Number One
Williamson and colleagues' systematic review and meta-analysis (PROSPERO-registered, searched through September 2023, 20 studies, 9,221 golfers): lifetime injury prevalence — 73.5% for professionals, 56.6% for amateurs (RR = 1.50); a professional's risk of low back pain is 3.05 times an amateur's, wrist injury 3.33 times. Among amateurs, low back pain accounts for 15–35% of all golf injuries; a professional's lifetime history of back pain reaches as high as 55%.
A Hypothesis: Repetitive Traumatic Discopathy
In 2019, Walker and colleagues proposed the "repetitive traumatic discopathy" hypothesis in the *Journal of Neurosurgery: Spine*: the torsional loads of the modern high-X-factor swing, stacked onto a professional's 300-plus swings a day, impose asymmetric loading on the discs and facet joints, producing lumbar degeneration earlier than in the general population. Sugaya's imaging work on Japanese professionals found degeneration skewed toward the trail side, consistent with the hypothesis.
But the authors drew their own boundary line too: independent studies have not been able to explain back pain by "crunch factor" (trunk rotation speed × lateral flexion) alone. The hypothesis is elegant; the evidence is still en route. And it echoes Chapter 2: this is why "deliberately cranking out a bigger X-factor" is a bad idea — the payoff is unproven (r = 0.02), while the cost has a hypothesis behind it.
The Body Keeps the Books
The disc hypothesis is about "what the structures are enduring"; this section is about "what the muscles are doing." The swing is reshaping the body, and the body is booking every swing. The three lines of evidence below are three entries in the same ledger.
The firing order. McHardy and Pollard's 2005 review assembled the EMG data on professionals: the downswing shows a roughly sequential activation — scapular stabilizers and the hip/knee complex first, the trunk exploding after. (This is a summary of the source data; the original wording is more cautious than that.)
The compensation. The trunk-EMG comparison between golfers with and without back pain comes from Cole and Grimshaw 2008: low-handicap golfers with LBP showed reduced erector spinae activation at the top of the backswing and at impact, with the external obliques compensating upward — the body completing the motion by improvisation.
The structural imprint. Izumoto and colleagues' 2019 MRI comparison found that long-term golfers' trunk muscle volume ran about 15–24% greater than non-golfers', with significant left–right asymmetry across multiple muscles (p < 0.05) — in right-handed golfers, the left abdominal wall musculature was larger, and the right rectus abdominis was larger.
Put the three together: the swing repeatedly "lights up" the same muscles; the muscles first improvise their way through the motion, then write the improvisation into structure through asymmetric growth. Adaptation itself is manufacturing new imbalance — and that is the muscular footnote to this chapter's opening line, that the bill mostly goes to the low back.
Load Monitoring: Everybody Believes, Nobody Does
In 2025, Watson and colleagues published golf's first practice survey on load monitoring in *JSCR* (n = 89: swing coaches, S&C coaches, medical staff): nearly everyone agrees load monitoring matters, but few actually collect data — an enormous belief–practice gap. Among the S&C coaches who answered that question (n = 31), the most-used tools were RPE (77%), lower-limb power/strength (68%/64%), sleep (52%), recovery questionnaires (39%), and HRV (19%).
Golf still has no validated load metric (nothing like mileage for runners or ACWR for field sports). The rough-and-ready version: ball count × clubhead speed — use a launch monitor to log daily swing count and average clubhead speed as "volume × intensity." The classic injury window: the amateur who barely trains and then suddenly hits 250 balls in a day — chronic load near zero, acute spike. A textbook injury recipe.
Back to Chapter 1: Do We Really Need Aerobic Training?
In version 2.0 I gave a concrete recommendation: in the off-season, run 10–20 minutes continuously at 75–80% of max heart rate to build "competition recovery capacity." Three years later, an honest re-examination.
The logic behind it hasn't changed: four to six hours, nine kilometers of walking, recovery needed between forty explosive efforts — a better aerobic base means faster recovery and lower perceived fatigue. But the direct evidence ("aerobic training → better golf performance" in controlled studies) is still missing; and the demands of golf itself barely call on the aerobic system. The 2026 evidence status: aerobic training is a health habit and a recovery aid, not a clubhead-speed tool.
So the revision: treat it as a general health investment — 2–3 sessions a week, 20–30 minutes of moderate intensity, especially worth it for golfers over forty — but don't expect it to raise clubhead speed, and don't keep piling aerobic volume ahead of the season: it crowds out the power training that actually raises clubhead speed. The 2.0 recommendation is downgraded to a mild suggestion, ranked behind explosiveness and strength.
Chapter 7: What to Measure, How to Measure — The Toolbox
The first six chapters answered "why." This one answers "how do you know you're training the right thing." Choose the wrong test, and you'll never even know you're training in the wrong direction.
Launch Monitors: What to Trust, What Not To
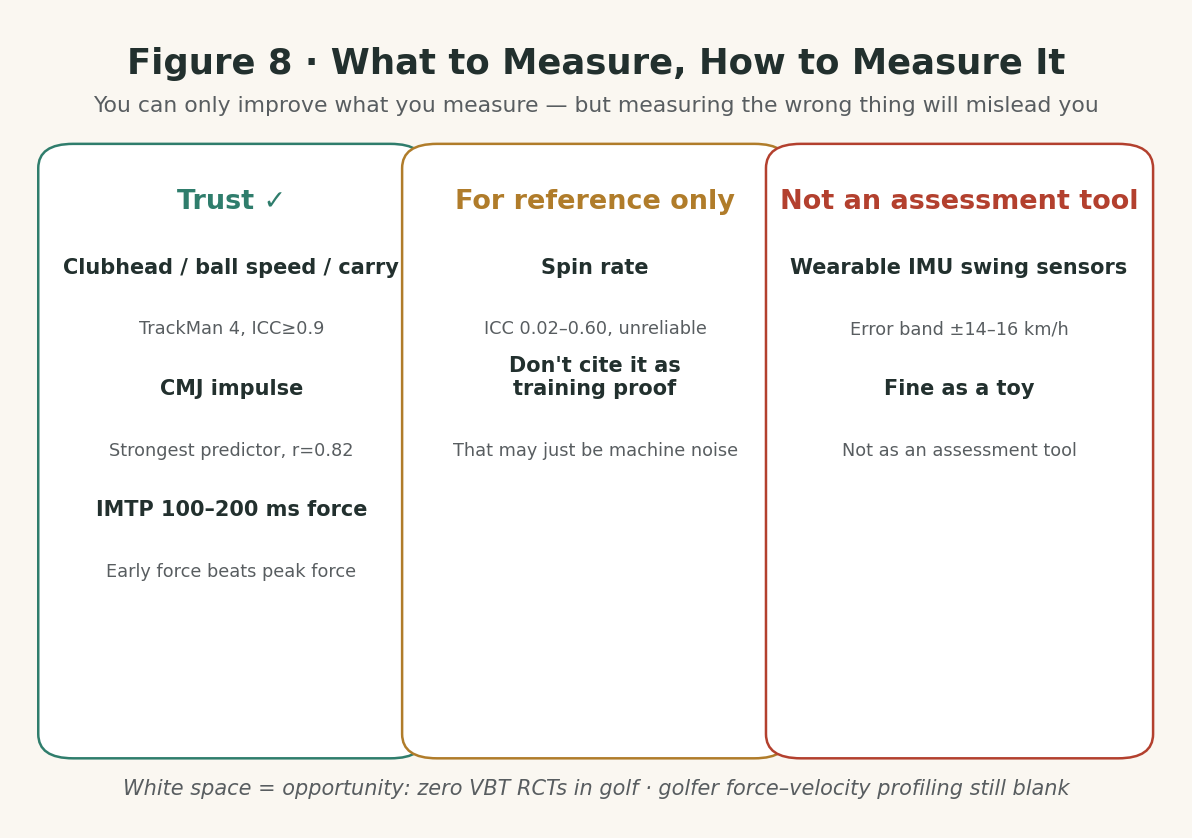
TrackMan 4's reliability has been nailed down (Bishop et al. 2023, *J Sports Sci*; Shaw et al. 2023, *JSCR*): clubhead speed ICC = 0.99, ball speed 0.97–0.99, carry 0.91–0.97 — these numbers are safe to use for tracking training effects.
But spin rate is not reliable (ICC 0.02–0.60, drifting significantly between sessions). Don't use changes in spin rate to argue "my training worked" — that may just be machine noise. As for the wearable swing sensors on the market (phone-IMU-type products), their error band against radar runs ±14–16 km/h — fine as a toy, not as an assessment tool.
One sentence: use the launch monitor to track clubhead speed, ball speed, and carry; glance at spin rate, but don't make decisions on it.
Force Plates: Every Golf S&C Room Should Have One
Chapter 3's conclusion directly produces this chapter's recommendation: since CMJ impulse (r = 0.82) is the strongest predictor of clubhead speed, and since early force at 100–200 ms beats peak force, a force plate is the best-value device in golf S&C assessment.
What to measure: CMJ impulse, peak power, jump height; force at 100 ms / 200 ms in the isometric mid-thigh pull (IMTP). Robinson and colleagues' 2024 study of elite female amateurs: bench press 100-ms force correlated with clubhead speed at r = 0.70, and the high-IMTP-200ms group showed a clubhead-speed effect size of g = 1.13 — early force, confirming Chapter 3's conclusion yet again.
No force plate? Second best: phone slow-motion for jump height plus a tape measure for the seated medicine-ball throw (Hegedus 2016: most correlated with driver speed, most sensitive to training). Precision discounted; direction not.
The Gaps Are the Opportunity: VBT and Force–Velocity Profiling
VBT devices are already in the hands of tour S&C coaches, but the number of VBT randomized controlled trials in golfers is zero. Likewise, force–velocity profiling studies conducted specifically in golfers: not a single one — and with CMJ impulse the strongest predictor of clubhead speed, that is an obvious gap.
One more 2026 development, noted briefly: Shibata and colleagues used an explainable XGBoost model in *Scientific Reports* to predict carry distance (R² = 0.71), with SHAP analysis ranking the top three as clubhead speed, clubhead weight, and launch angle. Machine learning is arriving in golf, but samples are still small (n = 27), and cross-player generalization is the bottleneck. The direction is right: explainable, phased, personalized.
Chapter 8: The Training Plan — From Evidence to Practice
The first seven chapters were the "why." This chapter is the "how." Every recommendation carries its evidence grade: A means backed by randomized controlled trials or intervention studies, B means backed by correlational research, C means conventional practice — weak evidence but reasonable. "C" is not an insult; it's honesty. You should know what you're paying for when you train.
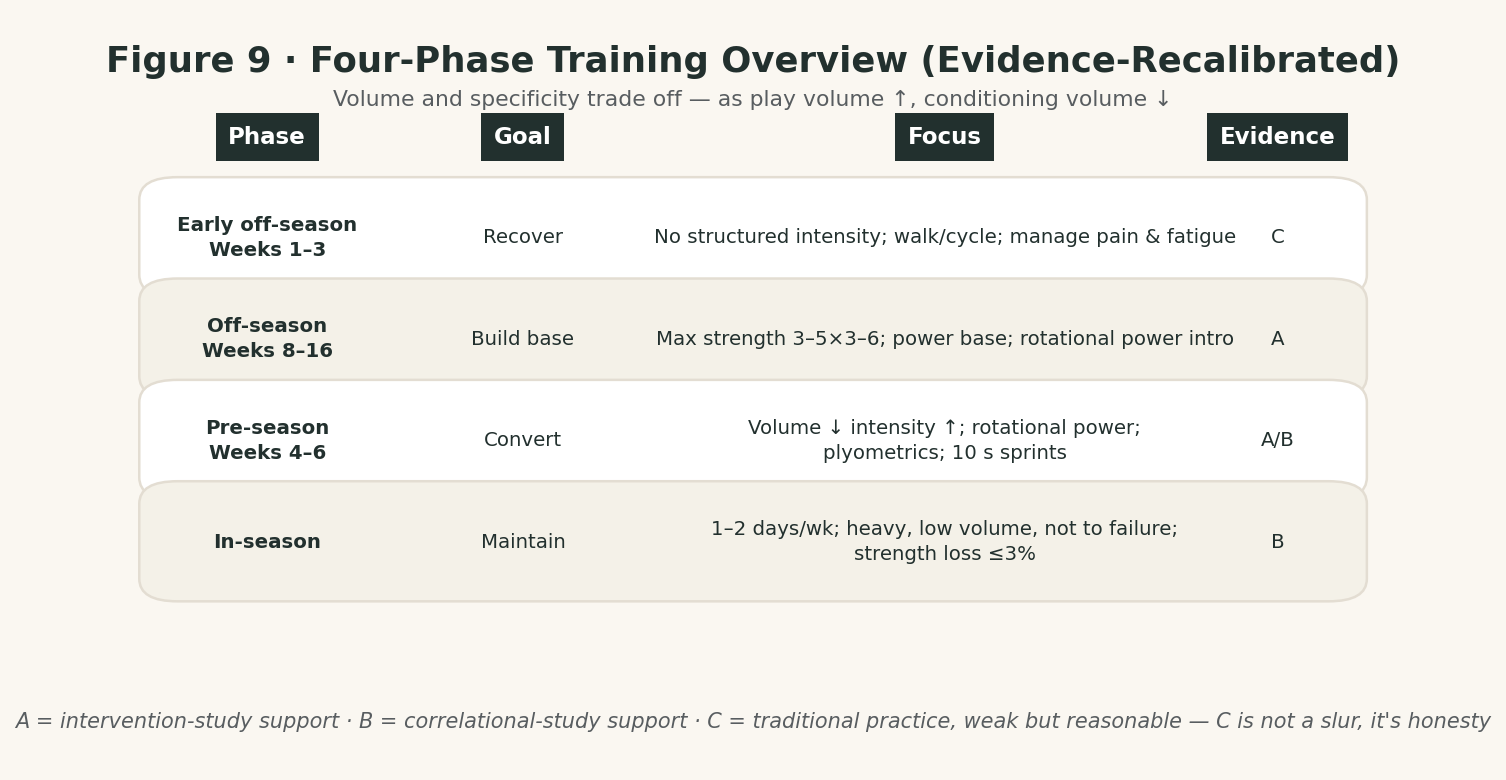
The Periodization Framework: Four Phases, Evidence Recalibrated
The four-phase skeleton survives from version 2.0, but what each phase trains and why has been recalibrated with new evidence. First, the governing principle: conditioning and golfing compete for the same pool of recovery resources — in the off-season, training eats more and golf eats less; mid-season, it's the reverse. Everything that follows is an elaboration of that one sentence.
Early off-season (weeks 1–3): recover. Don't rush into training. The goal here isn't to get stronger; it's to settle last season's debts: no systematic loading, just hiking, cycling, outdoor activities you enjoy, and dealing with the accumulated aches and mental fatigue. Teenagers especially must not skip this stretch — long-term development won't be ruined by three weeks off, but it will be ruined by injuries seeded in three weeks of unrecovered grinding.
Off-season (8–16 weeks): build the foundation. The one window of the year when you can afford to suffer, and the highest-volume eight to sixteen weeks of the year. Priorities: maximal strength (squat, deadlift, bench press, row — 3–5 sets × 3–6 reps at 85%+ intensity) [A] — remember the logic from Chapter 3: absolute strength is the foundation of power; power with a base (box jumps [A], power cleans [B] — low volume, high quality; better to do one set less than to do one ugly set); introduce rotational power (medicine ball rotational throws) [B]. Conditioning: 2–3 sessions of 20–30 minutes of moderate aerobic work per week as a health investment [C] — but don't expect it to raise your clubhead speed (that was Chapter 6's conclusion).
Pre-season (4–6 weeks): transfer to the course. The six weeks of moving gains "from the gym to the fairway." Total volume drops, intensity rises, specificity goes to max: cut strength training to a maintenance dose (2 days/week, heavy weight, low volume); shift power training to rotational specificity (single-arm medicine ball throws, ballistic bench press, rotational power cleans) [A/B]; keep plyometrics going (depth jumps, bounding) [A]; 10-second-or-less sprints with 5× rest [C] (borrowed from the general principle of sprint interval training — golf-specific evidence not yet available). Playing volume rises, and training and playing totals must move in opposite directions — that sentence is the single most important one in this entire periodization plan.
In-season: maintain. The goal can be said in four words: don't lose anything. One to two days a week, heavy weight, low volume, never train to failure. The target: no more than a 3% strength loss across the entire season (coaching-experience data from version 2.0). No novel stimuli and no max testing in competition weeks. Remember Chapter 4's lesson: stopping training means losing clubhead speed. "Use it or lose it."
Sample in-season maintenance day (60 minutes): 10-minute warm-up → squat 3×3 (85%, no failure) → power clean 3×3 → medicine ball rotational throw 3×6/side → cool-down. No max testing, no new exercises — the only pass/fail criterion is that you can play normally the next day.
Match-Day / Training-Day Warm-Up Template (15 Minutes)
Warming up is the one thing in this entire piece where evidence and common sense point in exactly the same direction — and it's the easiest thing to skip. Fradkin et al.'s 2004 RCT in *Br J Sports Med*: a 7-week golf-specific warm-up program increased clubhead speed. Fradkin et al.'s 2008 retrospective survey: golfers who didn't warm up adequately before a round were 3.2 times more likely to have reported an injury in the previous 12 months (OR = 3.2, p = 0.047; retrospective design, causality unestablished; the 1.3× figure for those who skipped warm-ups before practice didn't reach significance). Two conclusions, one action — warm up.
Here's the template (15 minutes, same for practice and rounds; the direct evidence for the exercise sequence is Fradkin's 7-week program, not this template — the template itself is a practitioner's synthesis [C]):
- 0–5 minutes: dynamic movement. Brisk walk 1 min → jumping jacks 30 sec → lunge with rotation, 8/side → side shuffle 20 m → high knees 20 m. Goal: get body temperature up, joints lubricated; no static stretching.
- 5–10 minutes: progressive swings. Start with a wedge: 5 balls at half swing → 5 at three-quarter swing → 5 full swings; repeat with a 7-iron; finish with 3 full-speed driver balls. Goal: switch the nervous system from "walking mode" to "swinging mode."
- 10–15 minutes: activation. Medicine ball rotational throws 2×6/side (light ball — chase speed, not force) → band shoulder external rotations 2×10 → glute bridges 2×10. Goal: light up the whole kinetic chain from Chapter 2, one link at a time.
One-sentence pass/fail test: when the warm-up is done, the clubhead speed on your first real shot of the day should reach at least 95% of your normal value. If it doesn't, the warm-up didn't do its job — add five minutes of progressive swings.
Don't Specialize Too Soon: Golf Collects Its Bill from Your Spine
Before we get to the junior template, a warning.
A 2026 systematic review and meta-analysis in PeerJ (search through March 2026, 15 studies, PMID 42730297) puts a hard, all-sports number on the table: adolescents who specialized early were twice as likely to get injured as multi-sport kids (OR = 2.00, 95% CI 1.58–2.55, p < .001) [B]. Moderate heterogeneity — interpret with three parts of caution. The American Academy of Pediatrics' 2016 position statement is more direct: for most sports, delay specialization until ages 15–16 (after adolescence) (Brenner et al., *Pediatrics*) [B]. The tracking data agrees: Güllich's research on world champions and Olympic medalists found that the medalists were precisely the ones who specialized later and played more sports as children [B].
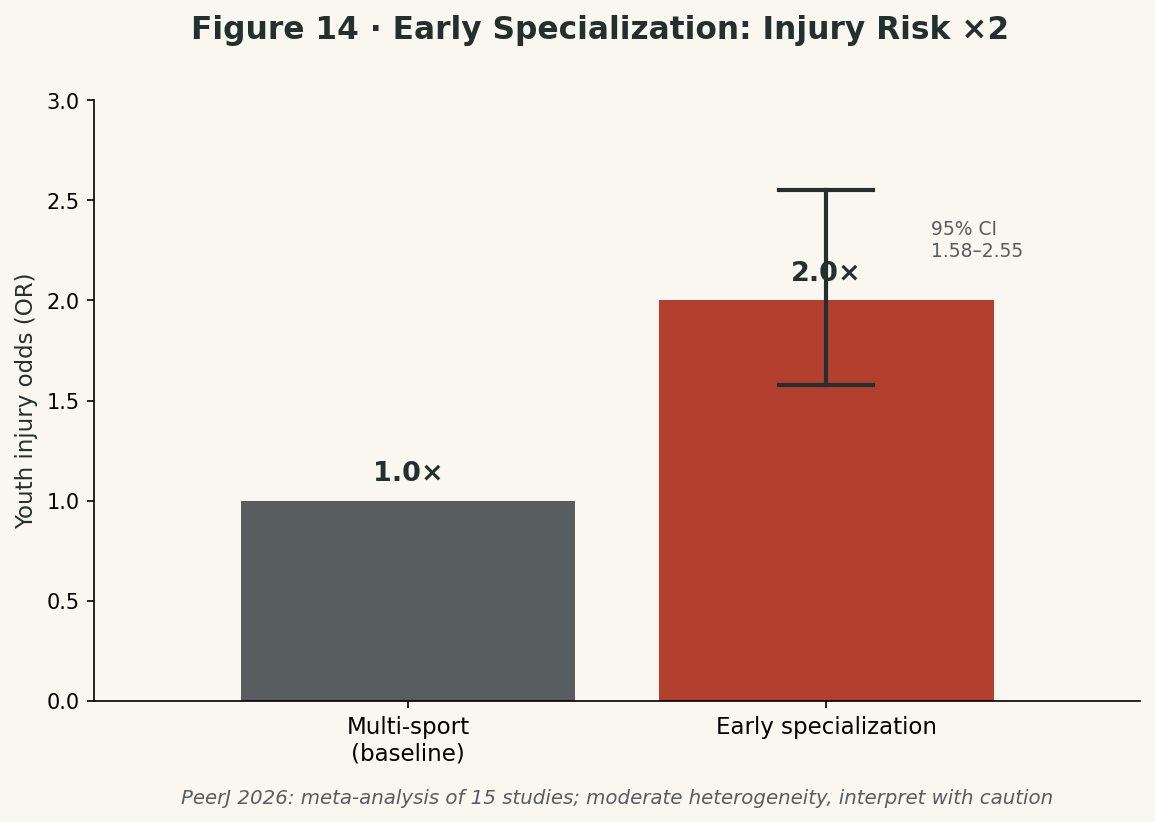
But for golf, that advice needs an extra layer. The cost of early specialization in golf isn't just "double the injury risk" — it's a bill written to the spine by one-sided rotation.
The golf swing is one of the most lopsided motions in all of sport: the same direction, the same rotational plane, hundreds of times a day. Walker et al. (2019) proposed the "repetitive traumatic discopathy" hypothesis: the torsional loading of the modern high-X-factor swing, stacked on a professional's 300+ swings a day, creates asymmetrical loading on discs and facet joints, producing lumbar degeneration earlier than in the general population (*J Neurosurg Spine*) [C] — a hypothesis, not a verdict. But the imaging gives it a corroborating profile: Sugaya's study of Japanese professionals found that lumbar degeneration does favor one side — the trail side (the trailing side of the swing path) — consistent with the hypothesis [B].
The body keeps a ledger of that lopsidedness. Izumoto et al. (2019) used MRI and found that long-time golfers' trunk muscle volume was about 15–24% larger than non-golfers', with significant left-right asymmetry (p < .05) in multiple muscles [B] — right-handed golfers' left abdominal wall musculature was larger, their right rectus abdominis larger (this appeared in Chapter 6's "the body keeps accounts"; here is its price side). Adult spines are already set, and they still get remodeled into asymmetry; adolescent skeletons are still developing, so their accounting of asymmetrical loading will only be more honest — and more expensive.
So golf's early-specialization problem is different from other sports': a runner who specializes early damages whatever the mileage accumulates on; a golfer who specializes early damages a spine that only rotates one way. Throwing a 12-year-old into year-round junior tours and grinding hundreds of specialized balls a day means starting that ledger before the skeleton has set.
That lands us back on this chapter's "objective function." What's the junior template's objective function? Maximizing the window-of-opportunity dividend — Shaw 2024 from Chapter 4: after 12 weeks of training, junior golfers' strength metrics showed effect sizes g of 1.29–2.06, numbers rarely seen in adult studies. And early specialization spends that dividend down: double the injury risk on one side [B], prematurely banked spinal asymmetry on the other [C].
There's an established theoretical foundation too. Lloyd and Oliver's 2012 YPD (Youth Physical Development) model: strength matters at every developmental stage, but training must be organized by biological maturity, not birth age [C] — a 13-year-old early maturer and a 13-year-old late maturer are not the same biological entity. The junior template's "movement quality > weight, relative strength, 2–3 days/week" is that model translated into practice.
Three practical recommendations (practitioner's synthesis, [C]):
- Before ages 15–16, multi-sport sampling takes priority over golf specialization — playing other ball sports is precisely how you hedge the spine against golf;
- Organize specialized training by biological maturity, not by age group;
- Don't skip strength training: Shaw 2024 proved juniors are the most generous responders to training — "kids shouldn't lift" forfeits exactly this window (already argued in Chapter 4, not repeated here).
Three Templates
Template 1: Juniors (ages 13–18)
First, kill the myth: there is no evidence that "lifting stunts growth." Pediatric sports medicine position statements agree that youth resistance training is safe and beneficial under qualified supervision; the reported injury rate for weightlifting-type movements is lower than for other forms of resistance training and for general sport. What should actually worry you is the 15-year-old from version 2.0: all golf, no strength work, back pain.
- Priorities: movement quality > weight; relative strength; vertical jumps and throws (Shaw 2024: juniors show the most dramatic training response [A])
- Frequency: 2–3 days/week, 60 minutes per session
- Sample day: 10' warm-up (jump rope + dynamic stretching) → power clean technique work 5×3 (light) → squat 3×6 → single-leg Romanian deadlift 3×8/side → medicine ball rotational throw 4×6/side → farmer's walk 3×40 m → cool-down
- Don'ts: no max attempts; no training to failure; deload volume in competition weeks but keep intensity
Template 2: Competitive adult golfers
The hardest crowd in this piece to please: already-trained, with time shredded by playing, and still demanding more clubhead speed. The whole plan is eight Chinese characters' worth of idea — build on strength, cash out through rotation: first drive maximal strength to the ceiling, then "claim" that strength as clubhead speed through rotational power training (Uthoff 2021: the general-plus-specific combination is optimal [A] — Chapter 4's conclusion lands here).
This group's objective function is one word: gain — turn every minute of training, in the shreds of time between rounds, into clubhead speed.
- Priorities: maximal-strength base + rotational-power transfer (Uthoff 2021: general-plus-specific is optimal [A])
- Frequency: 3–4 days/week in the off-season, 1–2 days/week in-season
- Sample day (off-season lower body): 10' warm-up → power clean 5×3 (85%) → squat 4×5 (85%) → depth jump 4×5 (full rest) → medicine ball rotational wall slam 4×8/side → Nordic hamstring curl 3×6 → cool-down
- Sample day (upper body/rotation): ballistic bench press 5×5 (fast) → seated medicine ball throw 4×6 (Hegedus 2016's most sensitive test [A]) → single-arm dumbbell row 3×8 → anti-rotation (Pallof press) 3×10/side → cool-down
Template 3: Golfers over 50
After 50, the objective function changes: when you're young you train to "gain"; at this age the first things to protect are muscle mass, bone density, and balance — all three racing against the clock. There's an evidence endorsement at the end of this template: the aging body still responds generously to training.
- Priorities: fighting decline — muscle mass, bone density, balance. The goal isn't +10 yards; it's "still hitting today's distance ten years from now"
- Frequency: 2 days/week, 45 minutes per session, moderate intensity, safety-first exercise selection
- Sample day: box squat 3×8 → seated row 3×10 → medicine ball chest pass 3×8 (light) → single-leg stand 3×30 sec/side → brisk walk 20 minutes
- Baseline: aerobic work (brisk walking/cycling) is worth more to this group than to younger golfers [C] — keep it
- Evidence endorsement: Thompson & Osness 2004 (men aged 55–79, 8 weeks of strength + flexibility): clubhead speed +2.7%, strength +35–60%; Thompson et al. 2007 (mean age 70.7): +4.9%. At this age, the objective function isn't "gain" — it's "don't lose." And the evidence says "don't lose" can be overdelivered [A]
Women Golfers: A Separate Conversation
Chapter 3 said "training expectations need a separate conversation," and here it is. Women's golf conditioning research is a disaster zone — when Robinson et al. did their 2023 women's-specific review, they found only 3 studies with all-female samples. Where data is scarce, honesty matters more than completeness. Every claim below is labeled with how much evidence stands behind it.
This group's objective function is the most unusual of the four: solve individually — use men's data as the starting point and your own test data as the finish line (Robinson et al. 2026: under individualized programs, the amateur group exceeded baseline standard deviations on 32 of 36 metrics).
The data picture (what drives clubhead speed in women golfers):
- Vertical jump impulse is the strongest correlate (r = 0.67, elite women; Johansen 2026) — same as men: lower-body power comes first.
- Upper-body power carries real weight: isometric bench press peak force r = 0.60 (Bishop 2026); bench press 100 ms early rate of force development r = 0.70 (Robinson 2024, 19 elite amateur women). Women's upper-body work shouldn't just be "toning" — it should train rate of force development.
- Trunk rotational peak power r = 0.59 (Bishop 2026) — significant, but nowhere near men's runaway 0.89.
- Anthropometrics (height, weight) correlate more strongly than in men — in the women's game, the ceiling that "training" can move is relatively smaller, and "selection" and "nutrition" carry relatively more weight. That's physiology, not bias.
Intervention evidence (does training work):
- Bishop et al. 2026 (*JSCR*): 11 collegiate players, 6 weeks of strength + 4 weeks of power — women made huge gains in isometric bench press 100 ms/200 ms early rate of force development (g = 3.79/3.04), with a carry effect of g = 0.84 that fell short of significance. The signal: women's neural response to strength-plus-power training is extremely sensitive; the boundary: n = 11, no control group, weak evidence.
- Robinson et al. 2026 (*JSCR*): 3 elite amateurs + 3 professional women golfers, 12 weeks of individualized S&C, 2 sessions/week — the amateur group exceeded baseline standard deviations on 32 of 36 metrics, the pro group on 23 — individualization is the keyword; elite women golfers vary widely, and one-size-fits-all plans waste talent.
- Hegedus et al. 2016: amateur women around age 58 — seated medicine ball throw training significantly increased driver clubhead speed and distance — women, older, still gaining.
Training essentials:
- Don't copy the men's plan wholesale. Upper-body power (seated medicine ball chest pass, ballistic bench press) deserves a bigger share of the women's program [B].
- The vertical jump (CMJ) is both women's strongest correlate and their most sensitive monitoring metric — test it once a week and gains are visible at a glance [B].
- Early rate of force development (100–200 ms) may be the key to women's clubhead-speed gains: it's exactly where women in Bishop 2026 gained most dramatically. In training, that means power days at "light load, maximal speed" [C — strong signal, weak evidence].
- Flexibility may deserve more investment in women golfers than in men (Robinson 2023's r = 0.52–0.71) — but with only 3 studies, treat this as an open question, not a conclusion [C].
The Exercise Library: Graded by Evidence Strength
The table below is this chapter's "armory" — every conclusion from the earlier chapters has to land somewhere on "so what do I actually train?" It's sorted by evidence strength: A means train with your eyes closed, B means worth training (mind the preconditions in the notes column), C means know what you're paying for, and "under investigation" is reserved for curiosity. When choosing exercises, first ask yourself: does this train something inside the 300-millisecond window?
| Evidence | Exercise | Trains | Notes |
|---|---|---|---|
| A | Squat, deadlift, bench press, row | Maximal strength | 3–6 reps/set, heavy weight; juniors reduce volume |
| B | Power clean, snatch variations | Total-body power | Golf-specific RCTs not yet available; evidence is cross-sport; high technical demand — learn from a coach |
| A | Box jump, depth jump, bounding | Lower-body SSC/rate of force development | Specificity to the 300 ms downswing window |
| A | Medicine ball rotational throw/wall slam | Rotational power | The training version of trunk rotational peak power r = 0.89 |
| A | Seated medicine ball chest pass | Upper-body power | One of the most sensitive test exercises |
| B | Vertical jump (CMJ) | Lower-body power | Both a test and a training exercise |
| B | Ballistic bench press | Upper-body rapid force production | Use a Smith machine or a throw-off variation; mind safety |
| B | Nordic hamstring curl | Hamstring eccentric strength | Injury prevention; indirectly protects power |
| C | Plank variations | Trunk endurance | Don't expect it to raise clubhead speed (Weston +3.6%) |
| C | Heavy static stretching | Flexibility | Admission ticket, not engine (Chapter 5) |
| Under investigation | Overspeed swing sticks | Neural speed | Evidence absent; experiment freely, but don't make it the staple |
Load-Management Checklist (Pin This Up)
The lessons of the first seven chapters, distilled into five lines. Print it and tape it to the gym wall:
- Log daily: total full-swing ball count + average clubhead speed (launch monitor)
- Weekly increase ≤ 10–15% (ball count and training volume counted together)
- Conditioning and playing move in opposite directions: playing ↑, conditioning drops to maintenance ↓
- In-season strength goal: loss ≤ 3%
- Pain rules: sharp pain stops the session; radiating pain or pain lasting two weeks → referral; low-back pain → first cut rotational loading
Recovery: The Other Half of Training
The whole piece has covered training, testing, and injury prevention — and never mentioned recovery. That's strange, because recovery is half of the training plan, and golf is the sport where "recovery" is most legitimate: each swing is a phosphagen-dominant effort (Chapter 1), while across a 4–6 hour round, dehydration, sleep debt, and energy deficit are the real enemies on the back nine.
Bishop et al.'s 2025 scoping review in *Sports Medicine* (recovery methods in professional and elite amateur players) lands honestly: empirical research on golf-specific recovery is scarce; the preliminary evidence points to targeted nutrition and hydration strategies, massage, and regular mobility work. Beyond that, adequate sleep and relaxation, sensible nutrition and hydration choices, and high-quality conditioning are the basics every athlete benefits from.
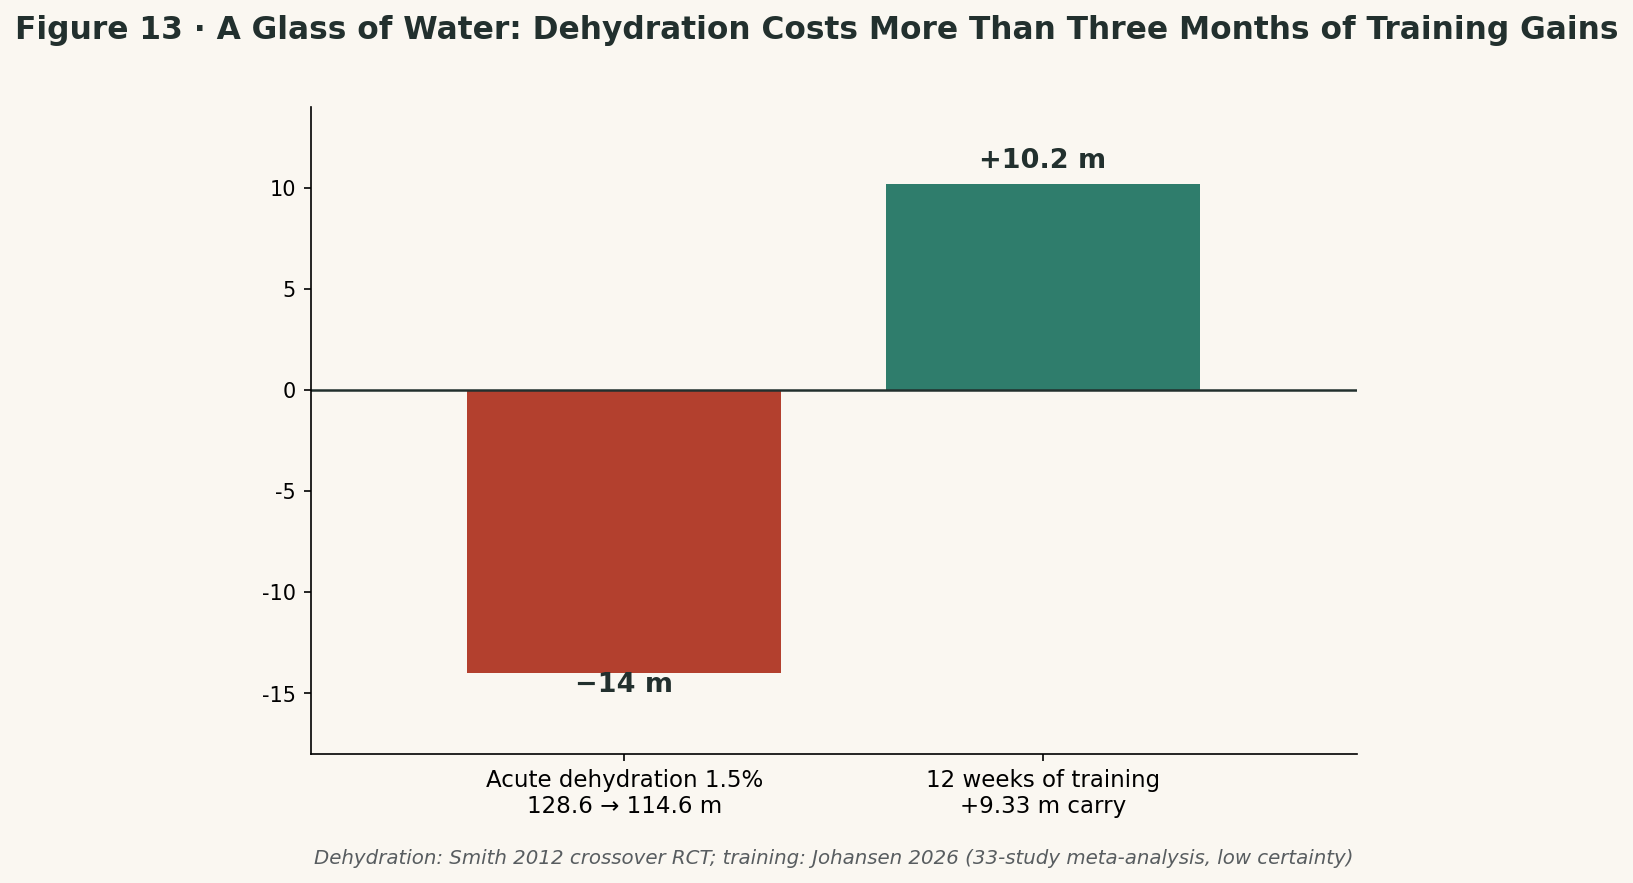
Dehydration is the hardest-evidence piece. Smith et al.'s 2012 crossover RCT: acute mild dehydration (about 1.45% body-mass loss) dropped driving distance from 128.6 m to 114.6 m, with accuracy and distance judgment impaired in tandem. 14 meters — more than three months of systematic training buys you. An 18-hole round in the sun routinely costs 1–2% of body mass. In other words: skipping water leaves three months of training gains in the water bottle.
Water doesn't just govern clubhead speed — it governs your protein shake's "delivery rate." Xin et al.'s 2026 crossover trial from Beijing Sport University (*Nutrients* 18(19):3267, n = 13): the group that drank nothing during exercise and dehydrated to 2.20% had post-exercise blood amino acid curves uniformly below the other two groups after a 45 g whey protein drink — total amino acids, BCAAs, leucine, isoleucine, glutamine all discounted (p < .05) at 60 minutes, with lower 0–120 min areas under the curve as well. The counterintuitive detail: the half-hydration group (1.18% dehydrated) showed no significant difference from the full-hydration group — drink half your fluids during training and protein response is preserved [B]. In one sentence: skip water and your protein shake goes to waste. (Boundaries: the measure was blood amino acid curves, not muscle protein synthesis; subjects were amateur men training at most 3 times per week; the exercise was treadmill running, not golf; "slower gastric emptying/nutrient transit" is the authors' mechanistic inference, not a direct measurement)
Recovery checklist (pin this up, continued):
- Sleep 7–9 hours [B]: cross-sport evidence is strong; golf-specific sleep–performance research is still accumulating
- 200–300 ml of fluid every 3–4 holes, electrolytes in heat [B]: Smith 2012 is the direct evidence
- Competition-day carbs 30–60 g/hour (generic endurance recommendation) [C]: golf-specific dosing research is blank
- Within 24 hours post-round: massage and regular mobility work have preliminary support [B/C]; ice baths and compression gear have no golf-specific evidence — labeled "unknown"
One last line: recovery isn't "what happens after training" — it's the precondition for the next session being worth doing. Put recovery in the plan with the same seriousness as the squat.
The Honesty Table: What 12 Weeks Can Realistically Buy You
| Population | Clubhead speed | Carry | Evidence basis |
|---|---|---|---|
| Amateur adults (systematic training) | +2–3 mph | +8–12 yards | Johansen 2026 meta mean |
| Juniors (window of opportunity) | +3–6 mph | +12–20 yards | Converted from the Uthoff 2021 review's effect-size range — an extrapolation, not a directly reported result |
| Competitive players with a training base | +1–2 mph | +5–8 yards | Ceiling effect (inferred from limited studies: Parker 2017, Doan 2006) |
| Women (systematic training) | +1–3 mph | +5–10 yards | Hegedus 2016 (significant gains in a 58-year-old women's sample), Bishop 2026 (n = 11, no control group); direct evidence is thin, ranges are extrapolations |
| Overspeed sticks only, no strength work | Unknown | Unknown | Zero long-term RCTs — honestly labeled "unknown" |
The last row is the most important part of this table. "Unknown" is also an answer — and a more responsible one than invented numbers.
Epilogue
The 2023 essay ended with a question: "How can strength and conditioning training take my golf safely to my own peak performance?"
Three years on, that question has a sharper edge — because the answer has changed its grain:
- Clubhead speed is, first, a power problem and only second a strength problem. Flexibility doesn't make this leaderboard.
- Speed comes from the ground, wired through trunk rotational power and lower-body explosiveness. The X-factor and the kinetic-chain sequence describe; they don't prescribe.
- Training works — modestly (+2.35 mph, +10.2 yards). Transfer is the only currency, and specificity the only exchange rate.
- Distance = clubhead speed × conversion rate. Physical training moves only the first half; technique decides the second. Failed transfer comes in two shapes: gym to clubhead speed, and clubhead speed to "usable distance."
- Mobility is an admission ticket; screening is a filing tool. Neither is a crystal ball.
- The back is this sport's invoice, and load management the only repayment plan. For juniors, don't rush to specialize — golf bills the spine.
- Track clubhead speed, ball speed, carry distance, and vertical jump. Backspin gets a glance, nothing more.
- Recovery is half of training: 1.5% dehydration costs 14 meters — more than three months of training buys you. Sleep and hydration go into the plan right next to the squat.
- Women players get their own conversation: upper-body rate of force development carries more weight, and individualization is the keyword. Until the research catches up, let your own test data be the answer.
- Overspeed sticks, VBT, load metrics — the blank spaces say "unknown." Those are reserved for the next three years.
"Clubhead speed is the speed at which you push the ground away."
Next time you step onto the tee box, try to feel it: that instant of explosion begins under your feet.
◆
References
参考文献
- Brennan A, et al. Associations between physical characteristics and golf clubhead speed: a systematic review with meta-analysis. *Sports Medicine*. 2024;54(6):1553–1577.
- Johansen MJ, et al. Effects of physical training interventions on golf shot performance: a systematic review with meta-analysis. *Sports Medicine*. 2026.
- Watson A, et al. Ground reaction force and centre of pressure during the golf swing and associations with clubhead speed and skill level: a systematic review. *Sports Medicine*. 2026.
- Johansen MJ, et al. Correlates of maximal driver club head speed in elite male and female golfers. *Scandinavian Journal of Medicine & Science in Sports*. 2026;36:e70255.
- Uthoff A, Sommerfield LM, Pichardo AW. Effects of resistance training methods on golf clubhead speed and hitting distance: a systematic review. *Journal of Strength and Conditioning Research*. 2021;35(9):2651–2660.
- Lephart SM, et al. An 8-week golf-specific exercise program improves physical characteristics, swing mechanics, and golf performance in recreational golfers. *JSCR*. 2007;21(3):860–869.
- Shaw J, et al. Twelve weeks of progressive resistance training positively improves physical fitness and golf swing performance in talented youth golfers. *JSCR*. 2024;38:1103–1110.
- Sung DJ, et al. Effects of core and non-dominant arm strength training on drive distance in elite golfers. *J Sport Health Sci*. 2016;5:219–225.
- Bliss A, McCulloch H, Maxwell NS. The effects of an eight-week plyometric training program on golf swing performance characteristics in skilled adolescent golfers. *Int J Golf Sci*. 2015;4:120–135.
- Hegedus EJ, et al. Traditional vs golf-specific resistance training in amateur women golfers (RCT). *Physical Therapy in Sport*. 2016;22:41–53.
- Lamberth J, et al. 6-week strength training: 1RM improved, no clubhead speed change. *Int J Golf Sci*. 2013;2:33–42.
- Williams AK, Glen J, Sorbie GG. 3-week upper-body sprint-interval training: power up, no golf transfer. *J Sports Med Phys Fitness*. 2022.
- Parker J, et al. 9 weeks isokinetic power training in pre-elite golfers: no CHS gain. *BMC Sports Sci Med Rehabil*. 2017;9:21.
- Cheetham PJ, et al. Comparison of kinematic sequence parameters between amateur and professional golfers. *Science and Golf V*. 2008;30–36.
- Cheetham PJ, Martin PE, Mottram RE, St Laurent BF. The importance of stretching the "X-Factor" in the downswing of golf. In: Thomas PR (ed.), *Optimising Performance in Golf*. Brisbane: Australian Academic Press; 2001. pp. 192–199.
- Myers J, et al. The role of upper torso and pelvis rotation in driving performance during the golf swing. *Journal of Sports Sciences*. 2008;26(2):181–188.
- Chu Y, Sell TC, Lephart SM. The relationship between X-factor and golfing performance. *J Sports Sci*. 2010;28(11):1251–1259.
- Kwon YH, et al. Kinematic sequence and X-factor vs clubhead speed in skilled golfers. *Applied Sciences*. 2020;10:5728.
- Quinn S-L, Olivier B, McKinon W. The efficacy of injury screening for lower back pain in elite golfers. *South African J Physiotherapy*. 2023;79(1):a1843.
- Walker CT, Uribe JS, Porter RW. Golf: a contact sport. Repetitive traumatic discopathy may be the driver of early lumbar degeneration in modern-era golfers. *J Neurosurg Spine*. 2019;31(6):914–917.
- Watson A, et al. Understanding training load in golf: a survey of swing coaches, performance practitioners, and medical staff. *JSCR*. 2025;39(1):e20–e29.
- Williamson TR, Kay RS, Robinson PG, Murray AD, Clement ND. Epidemiology of musculoskeletal injury in professional and amateur golfers: a systematic review and meta-analysis. *Br J Sports Med*. 2024;58(11):606–614.
- Fradkin AJ, Sherman CA, Finch CF. How well does club head speed correlate with golf handicaps? *J Sci Med Sport*. 2004;7(4):465–472.
- Bishop C, et al. TrackMan 4 reliability for clubhead speed and ball flight. *Journal of Sports Sciences*. 2023;41:2138–2143.
- Robinson L, et al. Physical attributes and golf performance in elite amateur female players. *Life*. 2024;14(6):674.
- Gordon BS, et al. Strength and power correlates of clubhead speed. *JSCR*. 2009;23(5):1606–1610.
- Cochran A, Stobbs J. *The Search for the Perfect Swing*. 1968.
- Hume PA, Keogh J, Reid D. The role of biomechanics in maximising distance and accuracy of golf shots. *Sports Medicine*. 2005;35(5):429–449.
- Shibata S, et al. Explainable machine learning for golf carry distance. *Scientific Reports*. 2026.
- Weston M, Coleman NJ, Spears IR. The effect of isolated core training on selected measures of golf swing performance. *Med Sci Sports Exerc*. 2013;45(12):2292–2297.
- Bourgain M, et al. Effect of horizontal ground reaction forces during the golf swing: implications for the development of technical solutions of golf swing analysis. *Proceedings*. 2020;49(1):45.
- Izumoto Y, et al. Bilateral differences in the trunk muscle volume of skilled golfers. *PLoS One*. 2019;14(4):e0214752.
- Cole MH, Grimshaw PN. Electromyography of the trunk and abdominal muscles in golfers with and without low back pain. *J Sci Med Sport*. 2008;11(2):174–181.
- Liu HH, Lin LH, Lin TY, Wu WT, Chang KV. Effects of core-inclusive physical training on clubhead speed in golfers: a systematic review and meta-analysis. *Life*. 2026;16(10):1609.
- Smith MF, Newell AJ, Baker MR. Effect of acute mild dehydration on cognitive-motor performance in golf. *J Strength Cond Res*. 2012;26(11):3075–3080.
- Bishop C, Xu J, Wilson L, Close G, Mountjoy M, Dunne D, Coughlan D, Turner A, Murray A. Recovery for professional and elite amateur golfers: a scoping review of evidence-based methods. *Sports Med*. 2025;55:2789–2807.
- Thompson CJ, Osness WH. Effects of an 8-week multimodal exercise program on strength, flexibility, and golf performance in 55- to 79-year-old men. *J Aging Phys Act*. 2004;12(2):144–156.
- Thompson CJ, Cobb KM, Blackwell J. Functional training improves club head speed and functional fitness in older golfers. *J Strength Cond Res*. 2007;21(1):131–137.
- Fradkin AJ, Sherman CA, Finch CF. Improving golf performance with a warm up conditioning programme. *Br J Sports Med*. 2004;38(6):762–765.
- Bishop C, Muir I, Gartshore A, Scott D, Coughlan D, Turner A, Murray A. The effects of a 10-week strength and conditioning intervention on physical capacity and golf shot performance in university male and female golfers. *J Strength Cond Res*. 2026;40(1):e32–e40.
- Robinson L, Murray A, Coughlan D, Ehlert A, Heeney C, Turner A, Bishop C. A 12-week strength and conditioning intervention: an individualized case series approach for 3 amateur and 3 professional female golfers. *J Strength Cond Res*. 2026;40(4):e373–e384.
- Robinson L, Murray A, Ehlert A, Wells J, Jarvis P, Turner A, Glover D, Coughlan D, Hembrough R, Bishop C. Effects of physical training and associations between physical performance characteristics and golf performance in female players: a systematic review with meta-analysis. *J Strength Cond Res*. 2023;37(12):e646–e655.
- Lauersen JB, Bertelsen DM, Andersen LB. The effectiveness of exercise interventions to prevent sports injuries: a systematic review and meta-analysis of randomised controlled trials. *Br J Sports Med*. 2014;48(11):871–877.
- McHardy A, Pollard H, Luo K. One-year follow-up study on golf injuries in Australian amateur golfers. *Am J Sports Med*. 2007;35(8):1354–1360.
- Fradkin AJ, Finch CF, Sherman CA. Describing the warm-up habits of recreational golfers. In: *Proceedings of the World Scientific Congress of Golf*; 2008.
- Broadie M, Ko S. A simulation model to analyze the impact of distance and direction on golf scores. *Proceedings of the 2009 Winter Simulation Conference*. 2009.
- Broadie M. Assessing golfer performance using golfmetrics. In: *Science and Golf V*. 2008, pp. 253–262.(Golfmetrics 数据库;长杆整体 9.3 杆/轮、纯开球 4.3 杆/轮的出处)
- Association between youth athletes' sports specialization and injuries: a systematic review and meta-analysis. *PeerJ*. 2026. PMID: 42730297. DOI: 10.7717/peerj.21680.(15 项研究;OR=2.00;中等异质性)
- Brenner JS, et al. Sports specialization and intensive training in young athletes. *Pediatrics*. 2016;138(3):e20162148.(美国儿科学会官方声明)
- Güllich A, Emrich E. Considering long-term sustainability in the development of world class success. *Eur J Sport Sci*. 2014;14(Suppl 1):S383–S397.(世界冠军专项化追踪)
- Lloyd RS, Oliver JL. The Youth Physical Development Model: A New Approach to Long-Term Athletic Development. *Strength Cond J*. 2012;34(3):61–72.(理论模型,非实证研究)
- Smith CJ, Lubans DR, Callister R. The effects of resistance training on junior golfers' strength and on-course performance. *Int J Golf Sci*. 2014;3(2):128–144.(差点 p=0.27;作者自述效力不足)
- Xin et al. *Nutrients*. 2026;18(19):3267.(练中脱水 2.2% 对练后乳清蛋白血氨基酸响应的影响;n=13 交叉试验)
- Ichikawa D, Suzuki T. An examination of the 15-ball driver shot test for predicting golf players' scores.(作者自存档版本;期刊信息未核实)
- Sugaya H, Tsuchiya A, Moriya H, Morgan DA, Banks SA. Low back injury in elite and professional golfers: an epidemiologic and radiographic study. In: *Science and Golf III: Proceedings of the World Scientific Congress of Golf*, Farrally MR, Cochran AJ (Eds.). Champaign, IL: Human Kinetics, 1999, pp. 83–91.(日本职业球员腰椎退变优势侧偏向)